
This article is the second in a series providing insight on why government leaders need to look beyond economic development and prioritize the overall well-being of citizens. The first article explored how countries that focus on overall societal well-being are more resilient , and the third article will cover direct actions that governments must take for the short- and long-term development of countries and their citizens.
There is much concern about rising inequality around the world—and rightly so. However, discussions of inequality often miss a key point: it is an exceptionally complex issue. Inequality comes in different forms, and it is driven by different factors, depending on the country and its historical and current economic context. Frequently, inequality is perpetuated by troubling feedback loops, and it disproportionately impacts marginalized groups.
That complexity is critical to understand if nations are to address their specific inequality challenge. Too often, solutions focus largely on the redistribution of income and wealth. Certainly, redistribution policies—including those that affect tax rates and social safety nets—have a critical role to play. But strategies to combat inequality often underemphasize the need for regeneration: making collective investments in areas such as health care, education, entrepreneurship, and employment that support marginalized groups to fundamentally improve their situation rather than merely survive. A greater effort in regeneration that enables people to have agency to advance their well-being will help drive sustained progress in reducing inequality and, ultimately, could require less redistribution.
Governments that fail to appreciate the complexity driving inequality will struggle to address it, posing real risks.
Governments that fail to appreciate the complexity driving inequality will struggle to address it, posing real risks. Consider the complexities of high income inequality. First, it creates distortions in economic resource allocation, hampering growth. Second, it has a negative impact on citizen well-being. BCG’s Sustainable Economic Development Assessment, a comprehensive diagnostic for tracking the relative well-being of countries around the world, found that countries with high income inequality tend to have a weaker record of converting their nation’s wealth into well-being for their citizens —and that translates into lower levels of happiness. Such dissatisfaction can undermine general support for government, and it has played a role in the rise of populism and even civil unrest and violence in some countries in recent years. The COVID-19 pandemic makes taking effective action on income inequality even more urgent because it threatens to exacerbate inequality: after significant reductions in poverty over the past couple of decades, the pandemic now threatens to push more than 70 million people into extreme poverty, according to World Bank estimates.
Of course, it has proved difficult in many countries to make progress on inequality given the lack of agreement among citizens and among policymakers about the right prescriptions and given the complex political dynamics. However, governments should not allow those obstacles, nor the complexity of the challenge in general, to lead to paralysis. Rather, they should look for ways to begin the journey of building more equitable and equal societies by focusing in two areas. First, they should improve access to quality education, health care, and employment. Such actions should include collaborating with the private sector so that governments can move from a focus on creating safety nets that support people to an emphasis on providing trampolines that help them advance. Second, governments should strengthen critical enablers of equity—governance, policies and regulations, tax and social-protection programs, and infrastructure.
Such an approach will help governments create a dynamic economy, one in which people can shape their own future, rather than depend on government support. That will ultimately foster a more equitable distribution of income, access to opportunities, improved social mobility, and greater inclusion and well-being.
Trends in Inequality
There are two broad categories of inequality: inequality of outcomes and inequality of opportunity. Inequality of outcomes includes not only income inequality but also wealth inequality and consumption inequality. Certainly, income is not a proxy for wealth. However, due in part to the limited data on wealth globally, we use income as a primary metric.
Opportunity inequality is reflected in unequal access to opportunities such as health care, education, and employment based on circumstances beyond an individual’s control (including gender, disability, ethnicity, and family background). (See “Assessing Income and Opportunity Inequality.”)
Assessing Income and Opportunity Inequality
Measuring opportunity inequality precisely is challenging because one needs to determine the exact portion of inequality for a particular outcome (income or wealth, for example) that is caused by a person’s limited opportunity. For example, what portion of a person’s income is limited because of the lack of educational opportunity. In addition, data about individual circumstances may not always be available at a country level and, thus, cross-country comparisons may be difficult. For the purposes of this article, we use inequality in education and life expectancy and access to basic services (such as sanitation and electricity) to assess opportunity inequality.
A look at the trends in income and opportunity inequality globally and within individual countries shows that although there has been progress in some areas, inequality remains a significant challenge, and one that is likely to become more prominent in the wake of the pandemic.
The Good News. Global income inequality was rising before 1980 and then fell significantly from 1980 through 2013, according to the World Bank’s analysis of the global Gini coefficient. This trend reflects the growth in average incomes in populous developing countries, such as China and India, as well as in developing countries in Africa, Latin America, and the Middle East.
That income growth has also driven declining levels of poverty in many countries. The number of people in extreme poverty, defined by the World Bank as individuals living on $1.90 per day (adjusted for purchasing power parity), has fallen from nearly 1.9 billion in 1990 to about 650 million in 2018. Although extreme poverty is still a major issue in many parts of the world, this is meaningful progress.
Of course, many would argue that an income of $1.90 per day is wholly insufficient and, therefore, the extreme poverty line is set too low. That’s one reason why it is important to also look at broader indicators of poverty to assess this progress. The multidimensional poverty index is a measure of education, health care, and standards of living developed by the United Nations (UN). Since 2000, 65 countries, home to 96% of the population of the 75 countries assessed by the UN, significantly reduced multidimensional poverty, according to a report by the United Nations Development Programme (UNDP) and Oxford Poverty & Human Development Initiative (OPHI).
Gains in the War on Poverty
From 2001 through 2011, the poverty rate in China fell from 41% to 12%, the equivalent of 356 million Chinese citizens moving out of poverty, according to the Pew Research Center. More recently, the Chinese government said that it has eliminated extreme poverty—although the definition of extreme poverty used by the government (earning less than $1.69 a day) is well below the level set by the World Bank. Meanwhile, the poverty rate in India dropped from 35% to 20%, indicating that 133 million Indians moved out of poverty. At the same time, both countries reduced multidimensional poverty, according to UNDP and OPHI.
Brazil, meanwhile, also saw a drastic reduction in extreme poverty. The government focused on poverty eradication through a series of programs, including Bolsa Familia (Family Grant), a conditional cash-transfer program through which parents receive a fixed monthly stipend in exchange for sending their children to school and complying with rules related to health checkups. The country also introduced a pension-like social assistance program that grants elderly and disabled people minimum wage payments if their income is lower than what they would earn working at minimum wage and if they do not qualify for other pension programs.
No doubt, all three countries still have significant challenges when it comes to poverty and equality. In Brazil, multidimensional poverty is particularly high, owing largely to limited access to health care. And income inequality in China and India are high, in part owing to persistent forms of inequality that are more prevalent in regional and rural areas than in urban areas. Although each country has made substantial progress, that should not obscure the fact that much work remains to be done.
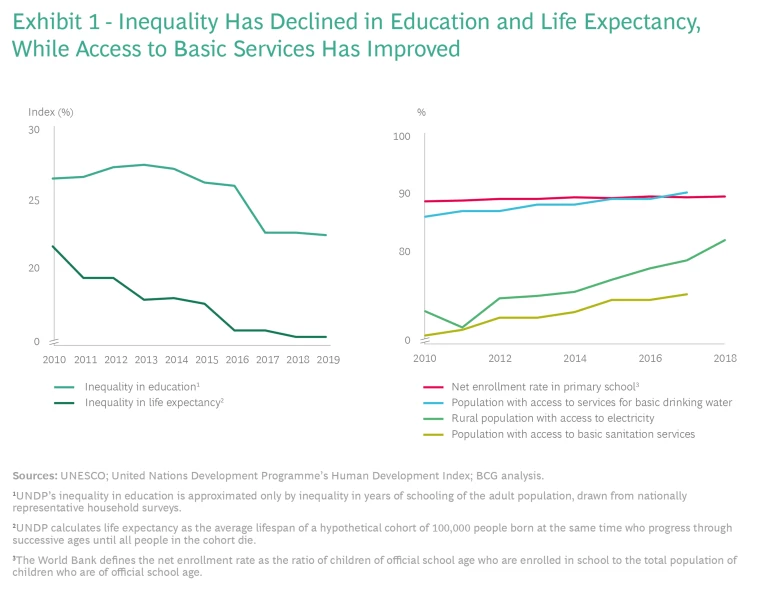
At the same time, there are signs that opportunity inequality has also improved. Inequality in education and life expectancy based on income has declined globally; access to drinking water, electricity, and basic sanitation services has improved; and access to education has held roughly steady at a high level. (See Exhibit 1.)
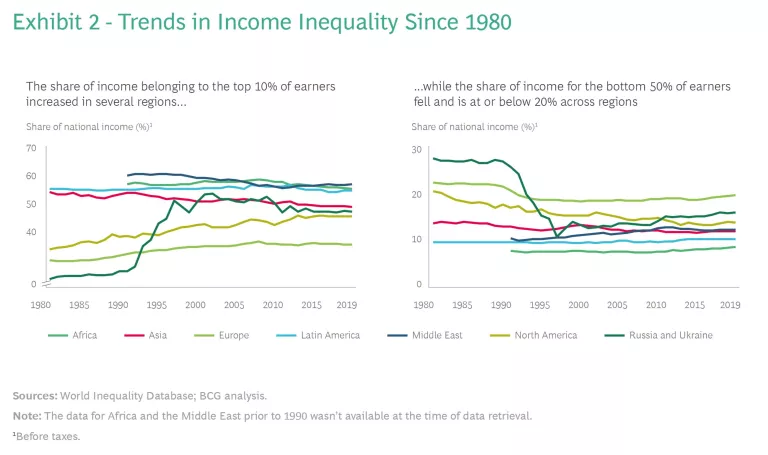
The Bad News: If global inequality has been on the decline, the same is not true for inequality within many regions and countries. From 1990 through 2016, income inequality, as measured by the Gini coefficient, increased in countries that account for nearly 70% of the world’s population, according to the UN.
If one looks at another measure of income inequality—the distribution of income across a population—the story is similar.
Certainly, there is significant variation when one looks at countries individually. Still, even in those that have made great strides in reducing inequality, the issue remains a persistent problem.
For countries and regions with high levels of income inequality, there are significant long-term repercussions, including the erosion of social mobility. In countries with relatively high levels of income inequality, such as Brazil, India, South Africa, and the US, the income of children is more dependent on that of their parents than it is in countries such as Denmark and Finland that have lower income inequality, according to research by the World Economic Forum . This transmission of disadvantage is true not only for income but also for education and occupation: in some countries, children attain little more education than their parents did or end up in occupations similar to those of their parents, according to research by the Organisation for Economic Co-operation Development.
The COVID-19 pandemic is likely to amplify the inequality challenge for a number of reasons:
- First, the pandemic is likely to reverse some of the gains made against poverty in developing countries where vaccines are not being as quickly deployed and the return to normal will take longer.
- Second, lower-income individuals and families tend to have limited access to adequate health care and affordable COVID-19 testing.
- Third, in many places, the shift to virtual learning disadvantaged children from low-income households that have limited access to technology. According to UNICEF, at least one-third of the world’s school children—463 million—were unable to access remote learning when COVID-19 shuttered their schools.
- Fourth, the slowdown of the global economy disproportionately affected low-skilled and low-wage employees. That’s because industries that have large numbers of workers whose average hourly wage is comparatively low and whose average number of hours worked per week is also relatively low—the hospitality and retail industries, for example—have been heavily hit. And the pandemic has expedited the adoption of technology, with companies likely to adopt more automation going forward .
- Fifth, wealthy investors have gained even more ground over the past year and a half relative to people without sizable investment portfolios. That’s because even after factoring in the massive market declines during the first quarter of 2020, the stock market has posted robust gains over that period.
The Complexity of Inequality
Inequality is a complex problem for a couple of reasons. First, it exists in different forms. And some forms, such as income inequality, link to and reinforce many other forms. Second, the magnitude and drivers of inequality differ in each country.
Looking at income and opportunity inequality reveals how different forms of inequality impact and reinforce one another.
Linkages Among Different Forms of Inequality. A close look at income and opportunity inequality reveals how different forms of inequality impact and reinforce one another. For example, income inequality can create unequal educational opportunities for a group—opportunities that are often further limited by gender and race. Without an education, however, job opportunities for members of the group will be limited, diminishing their lifetime income potential and furthering income inequality.
That dynamic is often experienced by disadvantaged groups, including women, people with disabilities, those from certain races and ethnic backgrounds, and young people. Frequently, these groups are systematically excluded from or discriminated against by education systems and labor markets, resulting in higher income inequality and opportunity inequality.
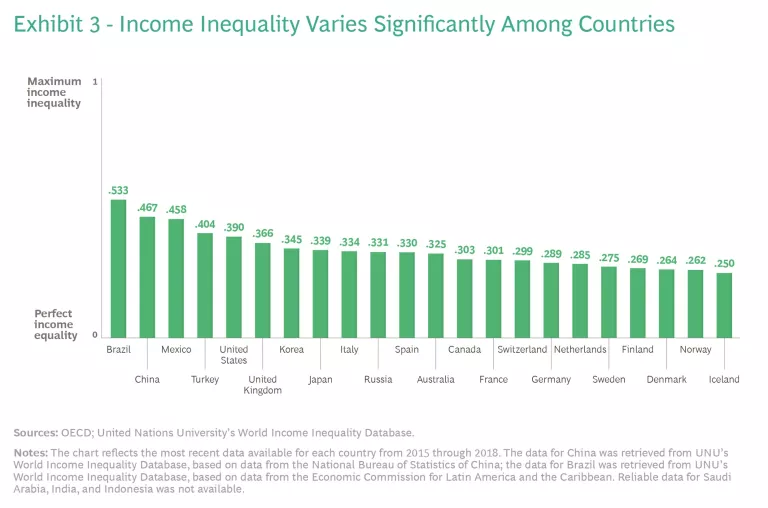
Differences in Magnitude and Drivers. Some countries clearly have a greater inequality challenge than others. Looking specifically at the 17 countries with the largest economies for which recent Gini data is available and the 5 Nordic countries (often lauded for progress on equality), a wide variation in income inequality is evident. (See Exhibit 3.) For example, while the US, Australia, and many countries in Europe are developed nations with similar levels of wealth and natural resources, the US has a much higher level of income inequality. That disparity indicates that government policy plays a major role in determining income inequality levels.
Just as the magnitude of income inequality differs by country, so, too, do the drivers. Drivers can include the degree to which health care and education systems are functional and inclusive; the extent to which certain communities, races, and genders are disadvantaged on the basis of country history; and even the factors that create economic growth. For example, countries whose economies rely heavily on natural resource-based industries tend to have higher levels of inequality than do countries whose economies are based on agriculture or manufacturing.
The Complex Dynamics in the US and Europe. The complexities outlined here shape the inequality challenge for each country and region—and, therefore, the required policy response from individual governments. A close look at the dynamics in the US and Europe highlights the differences.
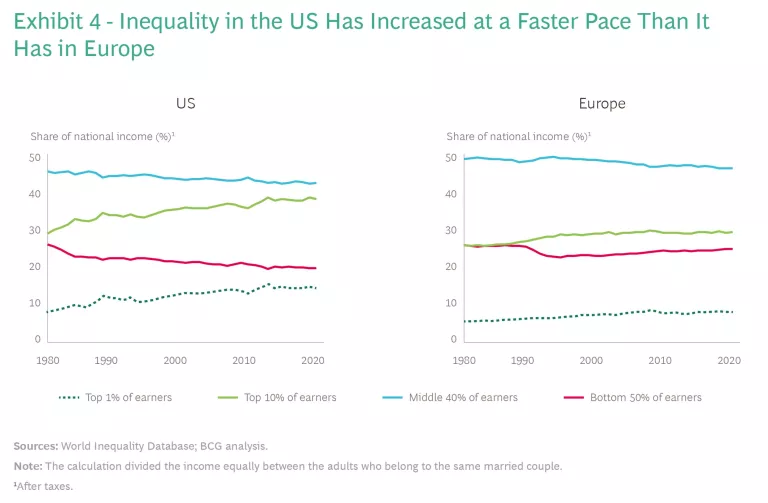
In the US, income inequality has risen more since 1980 than in any other developed country, according to research by UNDP. In 1980, 50% of earners accounted for about 26% of the national income. In 2019, their share was 20%. During this period, the top 10% of earners’ share of income jumped from 29% to 38%, while the middle 40% of earners’ share dropped. Meanwhile, the share of income nearly doubled for the top 1% of earners, from 8% in 1980 to about 15% in 2019.
Racial inequality is a particularly persistent problem. The levels of both income and opportunity inequality—reflected in lower access to quality education, health care, decent jobs, and housing—are higher for Black Americans than they are for other groups. (By a decent job, we mean one that guarantees dignity, equality, a fair income, and safe working conditions.) Black households have the lowest average median income, well below that of white and Asian households, although close to that of Hispanic households, according to the Economic Policy Institute. About 40% of Black American households, compared with 15% of white households, had zero or negative net worth in 2016, according to the Institute for Policy Studies. And data from the US Bureau of Labor Statistics shows that the unemployment rate at the end of 2020 was 4 percentage points higher for Black Americans than it was for white Americans.
The overall inequality picture is quite different in Europe. Income inequality in Europe, while up since 1980, has not increased as dramatically as it has in the US. (See Exhibit 4.) For example, in Europe, the top 10% of earners’ share of national income increased by only 3 percentage points, from roughly 26% to 29%; the top 1% of earners’ share increased by only 2.5 percentage points. The bottom 50% of earners, while losing ground before 1995, have since seen their share of national income rise slightly by nearly 2 percentage points. It is worth noting that this improvement comes even as European countries have witnessed a heavy influx of migrants in the past few years. That trend has likely put pressure on welfare systems in those countries and exacerbated the income gap (as migrants often face initial difficulty finding employment largely due to language barriers and skills gaps).
Certainly, there is significant variation across countries in Europe—most notably, differences between Eastern and Western European nations. (See “A Closer Look at Europe.”) But overall, the US faces a greater inequality challenge owing to several factors:
- Social Spending. Government social spending (including amounts for education, health care, and retirement pensions) is markedly lower in the US than it is in Europe. In several large European countries, such spending as a percentage of GDP ranges from 21% to 31%, compared with 19% in the US.
- Access to Education. Schools in the US are funded by property taxes, which means that schools in affluent neighborhoods with a high tax base typically perform at a higher level than do schools in less wealthy areas. In Europe, schools rely more on central government funds and less on local funds—a policy that helps to keep a more level playing field when it comes to access to education. At the same time, although higher education in Europe is relatively cheap or in many cases free, in the US, high tuition fees shackle many young students with significant debt.
- Access to Health Care. Though the US spends more on health care as a percentage of GDP than do other developed countries, health insurance in the US is costly. And unlike most European countries, the US has no universal health care program.
- Worker Clout. Compared with other advanced economies, the US has lower minimum wages, a reduced role for unions, and higher CEO-to-worker pay ratios.
6 6 Some states have a minimum wage that is higher than the federal level, but many do not. Former Treasury Secretary Lawrence H. Summers and Harvard economist Anna Stansbury, among others, argue that the continued growth of large companies creates a monopsony for employees—meaning they have few options in terms of employers and little bargaining power. - Taxation. The corporate tax rate has declined in both the US and Europe. However, individual taxes in the US—including taxes on income and wealth—have become significantly less progressive, while the decline in progressivity in Europe has been much less pronounced. For example, in the US, taxes as a percentage of pretax income for the 400 highest-earning Americans fell from 70% to 23% from 1950 through 2018, while the tax rate for the bottom 10% of earners increased from 16% to 26% over same time frame.
7 7 According to the Forbes list of the 400 highest-earning Americans; tax rates include those for local, state, and federal taxes. ,8 8 Progressive Wealth Taxation, Emmanuel Saez and Gabriel Zucman, Brookings Papers on Economic Activity, BPEA Conference Drafts, September 5–6, 2019. Conversely, in Europe, although the average tax rate on the highest earners declined from 1995 through 2009, it has been increasing since then, according to Eurostat data, reaching an average of approximately 40% in 2019.
A Closer Look at Europe
In all European regions, however, taxes and transfers reduce the gap between the top 10% and bottom 50% earners, albeit to different degrees. That gap can be assessed by tracking the ratio of the average income of the top 10% of earners to the average income of the bottom 50% before and after taxes and transfers. On the basis of this analysis, taxes and transfers were most effective in Western Europe, reducing the gap by 29%, and least effective in Eastern Europe, reducing it by 15%.
But even within regions, the impact of government policies varies. If we look specifically at the impact of pensions and social transfers on inequality, we find that the impact across Northern, Southern, and Western Europe was greater than the impact in Eastern Europe. According to a study by Eurostat, pensions and social transfers had the most impact on income inequality in Sweden, reducing the Gini coefficient by 29.7 percentage points. In Portugal, Greece, and Germany, pensions and social transfers cut the Gini coefficient by 23.1 to 25.7 percentage points. By comparison, pensions and social transfers had less impact in Eastern European countries such as Serbia, Slovakia, and Latvia, reducing the Gini coefficient by only 13 to 19 percentage points.
An Approach for Tackling Inequality
Governments need to understand the dominant forms of inequality within their country and the drivers of those challenges in order to craft the right response. At the same time, they need to work in concert with the private sector and players in the social sector, including nongovernmental organizations and nonprofits, to identify the right steps and implement them effectively.
Most critically, governments need to balance income and wealth redistribution with policies that promote regeneration. In this way, governments can shift from establishing safety nets for citizens to creating trampolines—conditions that give people equal access to opportunities and empower them to thrive socially and economically.
On the basis of our work with governments around the world, we believe governments will need to move in two primary areas to begin tackling inequality. (See Exhibit 5.)
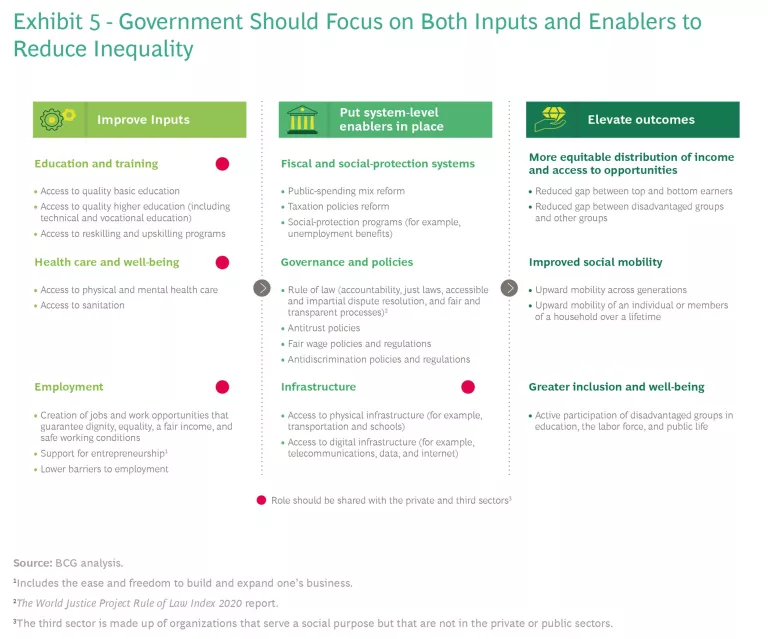
First, governments must redouble their efforts to improve the three elements (or inputs) that allow people to advance their situation:
- Education and Training. Governments should ensure that all citizens have access to a quality education. This especially includes early childhood programs that not only give youngsters a strong head start but also allow parents to participate fully in the labor market. In many regions, additional funding for schools and the expansion of the teaching workforce will be required. Governments should also partner with the private sector to design effective school-to-work transition programs. Critically, governments must take steps to make education a broad societal priority—including steps that support the efforts of parents to encourage their children to focus on their education. Research dating back as far as the 1960s has demonstrated a link between parental aspirations and child academic achievement. Parents who support the education of their children set them up not only for academic achievement but also for better opportunities and outcomes that reduce income inequality.
- Health Care and Well-Being. Restricted access to health care—both physical and mental—will severely limit the ability of citizens to advance their education and their careers. Governments should, in partnership with the private sector, address major gaps in those systems. And they must ensure broad and equitable access to COVID-19 vaccines in order to ensure that no groups are left behind as economic activity picks up steam.
- Employment. Events in recent years have underscored the importance of this component, with high levels of unemployment contributing to social unrest in a number of countries. Governments must implement robust policies, regulations, and processes to advance job creation, inclusive employment (such as incentives for hiring people with disabilities), and entrepreneurship. They should reduce barriers to starting a business. And they should expand the availability of reskilling and upskilling programs . These efforts should focus on both high- and low-skilled workers and give particular attention to improving employment opportunities for groups in society that are particularly disadvantaged, including new immigrants. Governments should also consider actions that recognize unpaid care and domestic work (with an estimated value of 10% to 39% of GDP, according to the UN) that is currently largely shouldered by women.
Second, governments must put three system-level enablers in place to ensure increased equity:
- Fiscal and Social Protection Systems. Governments must explore tax reform—on personal income and on corporations—in order to expand public spending on education and health care and to support disadvantaged groups. Any tax reforms, however, should be designed to avoid significant negative impact on job creation. At the same time, governments should assess social programs and systems . Such an assessment should include a close look at whether those programs and systems adequately protect those working in the informal economy. The findings of the assessment should be used to improve access to social programs and systems for those who need them most, including women, those with disabilities, and those in minority groups. These safety nets for vulnerable groups, however, should not be the primary means of support. Rather, governments should increase their focus on developing systems that provide vulnerable groups with enablement programs—essentially trampolines to improve their situations sustainably.
- Governance and Policies. Public sector leaders should push to improve or protect effective governance of public institutions and the rule of law. The latter, in particular, is vital, because corruption in many parts of the world limits the growth of small businesses. In addition, governments should adopt policies that prohibit discrimination and protect workers’ bargaining rights to ensure fair minimum wages. Governments should also adopt and enforce antitrust policies to block the excessive concentration of market power among large companies. Robust antitrust policies can have significant, positive ripple effects throughout an economy, including on the pace of new business creation.
- Infrastructure. As governments invest to develop physical and digital infrastructure within their country, they should pay particular attention to the regions most affected by inequality. Significant infrastructure investments in such regions can create jobs and power strong economic growth by lowering barriers to starting new businesses and smoothing the transportation of goods. The private sector can be a powerful partner in infrastructure development, and governments should find ways to leverage the private sector’s contribution, including through public-private partnerships. Such partnerships can be effective not only in the development of infrastructure such as roads and bridges but also in the construction and maintenance of assets such as social housing, hospitals, and schools.
The right mix of policies in all these areas can lead to a more equitable distribution of income and access to opportunities, improved social mobility, and enhanced well-being. As governments push to put these policies in place, they must also track and measure their progress.
Inequality remains a real and pernicious threat to societies around the globe, undermining growth and political stability. But any discussion on inequality should not lose sight of the fact that there has been great economic progress globally over the past two decades, with hundreds of millions of people rising out of poverty.
Of course, the COVID-19 pandemic threatens to reverse some of that progress. But it also creates a potent opportunity. Just as major social changes and advancements were born out of world wars and the Great Depression, this period of turmoil could yield significant change. With borrowing costs at historically low levels, governments have an opening now to strengthen education, health care, and employment within their borders and to build a solid foundation for progress that includes balanced tax systems and social safety nets, strong governance, and a robust infrastructure. Those governments that get it right will be able to protect the most vulnerable while giving everyone a chance to reach their full potential.
The authors would like to thank Noor Abdelhafez for her assistance in the research and analysis for this article.