US P&C insurers have performed well compared to their international counterparts. However, outperformance in the current macroeconomic environment demands a laser focus on profitable growth.
Uncertainty is a double-edged sword for insurers. Good underwriters recognize uncertainty as the basis for the success of the insurance industry . But uncertainty also makes it harder for insurers to expand their businesses profitably. From inflation and interest rates to climate change and cyber threats, today’s environment is rife with sources of uncertainty that are challenging for insurers to manage.
Profitable growth is the key to success for US P&C insurers.
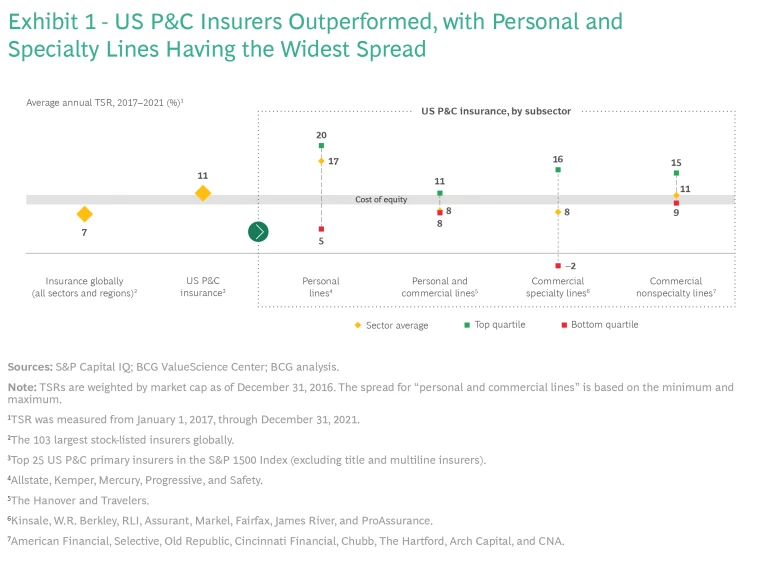
US property and casualty (P&C) insurers have weathered uncertainty relatively well in recent years. From 2017 through 2021, their average annual total shareholder return (TSR) was approximately 11%, compared with 7% for insurers across all regions and sectors. However, looking below the headline TSR figure for US P&C insurers, we see strong variations among top- and bottom-quartile performers and among market segments.
The many dynamic uncertainties in the business environment make it imperative for US P&C insurers to strengthen their capabilities to create sustainable long-term value. Our analyses point to profitable growth as the key to success. To maintain profitability while expanding their business, US P&C insurers must be agile to keep pace with the fast-evolving environment. To remain competitive, leaders will need to pursue efficiency, embrace embedded insurance and ecosystems as growth engines, future-proof the business for climate change , and strive for underwriting excellence.
US P&C Players’ TSR Outperformed the Global Average
In 2021, the average annual TSR for insurers across all regions we examined (the Americas, Europe, and Asia-Pacific) and sectors (P&C, life and health, reinsurers, and multiline insurers) was 16%—a marked improvement from –3% in 2020. However, the industry’s average annual TSR of approximately 7% for the five years from 2017 through 2021 was still below the cost of equity and placed the sector 27th among the 33 sectors we track. (We look at TSRs on a rolling five-year basis to illuminate long-term value creation; see “About Our Methodology.”)
About Our Methodology
In insurance, TSR derives from three sources: growth in tangible book value (TBV), change in the price to TBV (P/TBV) multiple, and cash flow contribution (comprising dividend yield and share buybacks). Over the long run, TBV growth and cash flow are the major contributors to TSR. Over the short to medium term, changes in the P/TBV multiple matter a lot more.
The most important challenge for management is to make the right tradeoffs among increasing TBV, deploying free cash flow, and expanding or protecting P/TBV multiples. BCG’s TSR methodology can help management to better meet these challenges. It helps insurers simulate such tradeoffs and make informed decisions about factors such as portfolio focus, capital allocation, and business units’ financial targets.
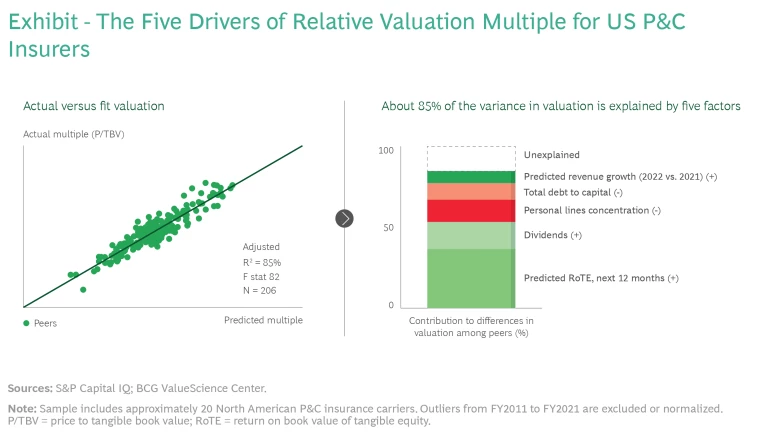
Making the right tradeoffs requires an accurate understanding of the impact of strategic and operational decisions not only on TBV growth and free cash flow but also on the P/TBV multiple. BCG’s Smart Multiple methodology, an integral part of our TSR methodology, uses regression analysis to estimate differences in P/TBV multiples. (See the exhibit.) In US P&C insurance, approximately 85% of the variance in a company’s P/TBV multiple can be explained by fundamentals: profitability metrics (such as RoTE), dividends, business mix (personal-line concentration), balance sheet health (debt to capital ratio), and predicted revenue growth. When we help an insurer chart a course for superior shareholder value creation, we develop a plan that accounts for the tradeoffs among the TSR drivers (TBV growth and free cash flow, for example) and the expected impact of each factor on the client’s P/TBV multiple. Our analysis also considers risks and long-term strategic implications.
US P&C insurers’ performance exceeded that of the overall global industry in the same five-year period with an annual TSR of approximately 11%. However, the sector-level average doesn’t tell the full story, as outperformance is possible in nearly all market segments. (See Exhibit 1.)
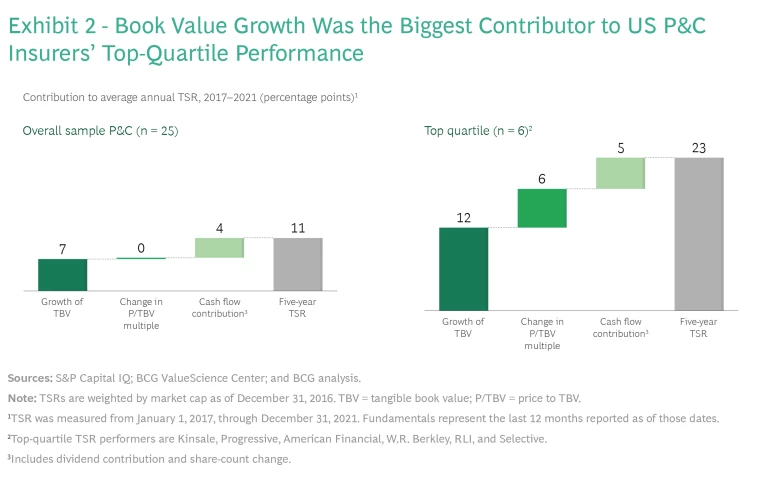
Top-quartile insurers had a five-year average annual TSR of approximately 23%, versus approximately 3% for bottom-quartile players. (See Exhibit 2.) Top insurers’ outperformance was driven primarily by stronger growth in tangible book value (TBV) (contributing 12 percentage points to TSR versus 7 percentage points for the entire US P&C sample) and multiple expansion (contributing 6 percentage points versus no contribution for the entire US P&C sample).
Across all US P&C segments, return on tangible equity (RoTE) remains a key driver of price to TBV (P/TBV) multiples, according to BCG’s SmartMultiple analysis. Investors’ expectations for RoTE explain approximately 40% of P/TBV variations among insurers, and RoTE is essential for enabling the growth of TBV. The consistent top performers typically deliver strong RoTE and growth to achieve sustained profitable growth.
Comparing Performance Across Market Segments
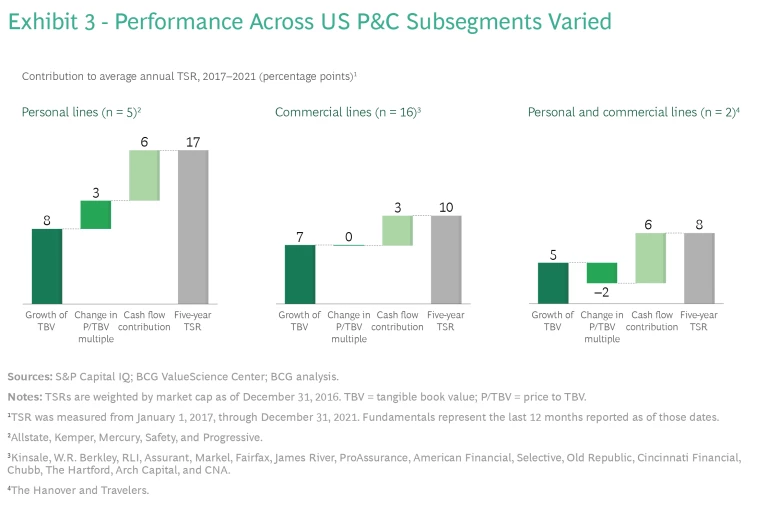
Performance and its underlying drivers varied significantly across different segments of the US P&C market. (See Exhibit 3.)
PROGRESSIVE LEADS AMONG PERSONAL INSURERS
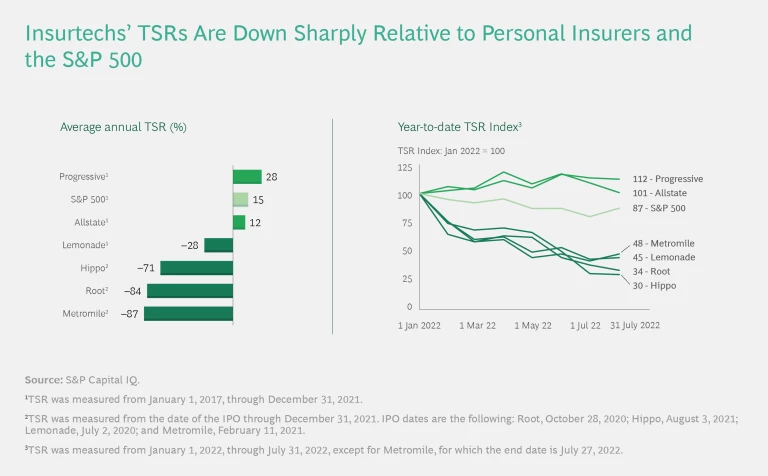
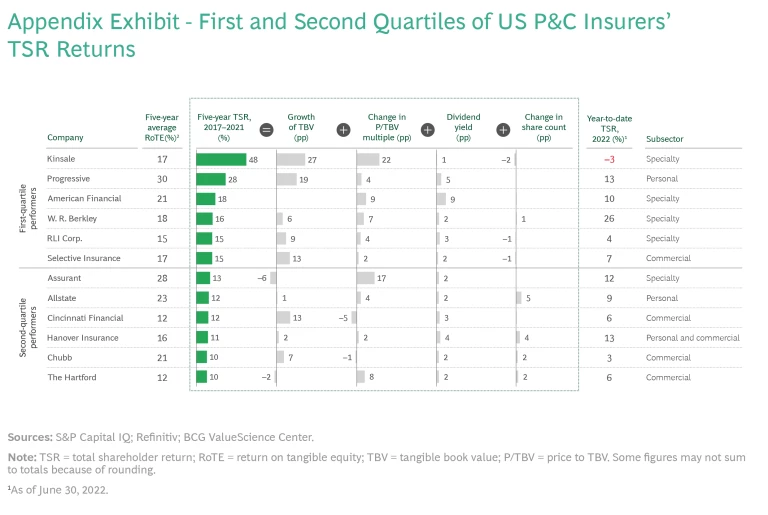
Personal insurers delivered a five-year annual TSR of approximately 17%. Progressive led the pack with its 28% TSR during the period, reflecting a strong contribution from growth (19 percentage points) and moderate multiple expansion (4 percentage points). Progressive’s significant boost to the segment’s average TSR is evident when we exclude the company from the analysis: the rest of the personal insurers in our sample delivered an average five-year annual TSR of approximately 10%, which was only slightly above the cost of capital. Progressive’s exceptional TSR demonstrates that underwriting discipline and data-driven decision making are key drivers of outperformance in US personal lines in this fast-evolving environment.
In the second half of 2021, results for all personal insurers were weighed down by a postpandemic rebound in frequency and the severity of auto claims driven by higher-than-expected replacement costs, used-car prices, and labor rates.
Publicly traded insurtechs, on the other hand, have all destroyed value since their IPOs, with annual TSRs of –50% to –90%. This value destruction highlights the challenges of achieving breakout profitable growth in insurance. (See “Insurtechs Must Shift Their Focus to Profitability.”) As one of many examples of the struggles insurtechs face, Hippo announced this July its intention to file for a reverse stock split after a period of noncompliance with New York Stock Exchange requirements—the company’s average closing price was less than $1 for a consecutive 30-trading-day period.
Insurtechs Must Shift Their Focus to Profitability
What went wrong? Initially, tech investors rewarded startups that delivered top-line growth, fast quotes, and better user experiences. The cheap funding allowed insurtechs to build disruptive digital capabilities and deliver satisfying customer experiences that incumbents were slow to bring to market. However, as the hype surrounding insurtechs subsided, it became clear that their business plans were inadequate and shortsighted for a complex and highly regulated industry in which the cost of goods sold is unknown at the time of sale. Although early IPOs benefited investors who cashed out, they hurt insurtechs’ sustainability. It is hard to simultaneously please tech investors, who tend to be focused on growth, and insurance investors, who are more oriented toward income and profits.
The early successes and ongoing struggles of insurtechs demonstrate a fundamental truth about the insurance business: growth is easy, but profitable growth is hard. The pressure on profitability is especially strong for companies expanding into new states, lines of business, perils, and customer segments. The risks include:
- Adverse Selection. Companies seeking growth might inadvertently attract risks declined by other carriers, which could have a significant impact on loss ratios. Unfamiliarity with underwriting nuances that established insurers apply to price risks also hurts the loss ratio. Indeed, for many insurtechs, it seems that underwriting was an afterthought.
- Mispricing. New entrants must rely on other insurers’ publicly filed pricing to make up for their inadequate insights and data—for example, they lack a deep understanding of policyholders and claims-experienced data. However, this reliance on other companies’ pricing means that new players might not consider important nuances when establishing their rate plans and overall pricing strategy.
- Claims Leakage. Because new players have less experience (and scale) in adjudicating and managing claims, they might be more prone to higher loss adjustment expenses and overall loss ratios.
- Reinsurance Instability. Launching new products in different states that target different customers may lead to volatile results for new entrants. This tends to raise concerns among reinsurance partners, leading to higher reinsurance rates and tighter terms and conditions.
These challenges, among others stemming from a lack of experience and data in new market segments, lead to a “new business penalty” for new entrants such as insurtechs and a competitive advantage for established players.
Delayed profitability and the challenges of reaching scale are shifting the power dynamics away from insurtechs toward incumbents. Softness in public markets has made the path to an IPO much more difficult at the valuation levels seen in the past, while rising interest rates have diminished private investors’ willingness to pursue risky investments in search of yield.
Looking ahead, insurtechs’ valuations might continue to fall, and the bottom is likely below that of traditional insurance companies. We already see evidence of the consequences of sharply declining valuations in Hippo’s need to do a reverse stock split and Lemonade’s acquisition of Metromile. High inflation and a looming recession might exacerbate the downward pressure on valuations. To survive, insurtechs will need to sharpen their focus on underwriting profitability.
Incumbents can benefit from this environment. The ongoing challenges may lead struggling insurtechs to increasingly pursue partnerships, commercial agreements, and even M&A with peers and incumbent carriers and brokers to achieve profitability and/or survive. Incumbents may be able to gain access at attractive prices to the skills, capabilities, and assets that insurtechs have been nurturing. Instability in private markets may also drive talent to more stable players, giving incumbents a chance to “acqui-hire” teams.
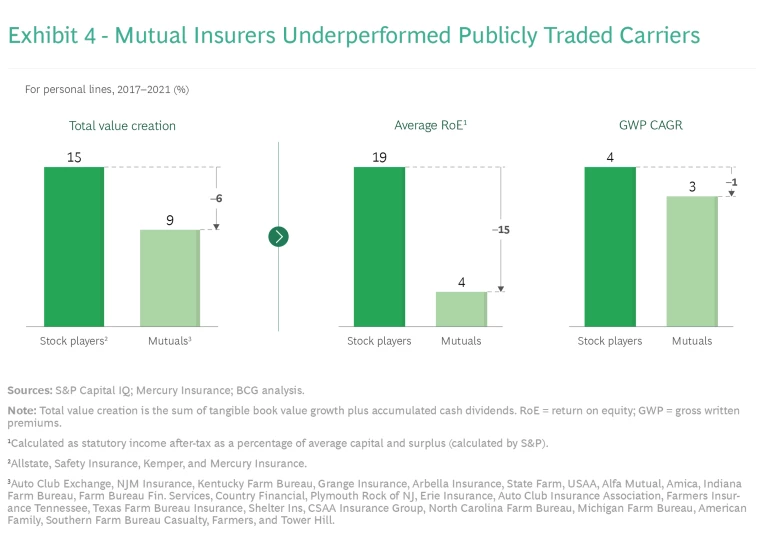
A comprehensive review of personal insurers must include an assessment of the performance of mutual insurers, as they account for more than 55% of the segment’s premium. Five of the top-ten US personal lines insurers are mutuals, including market share leader State Farm.
Because mutuals are not publicly traded, it is not possible to calculate their TSRs. A reasonable proxy, however, is total value creation (TVC): the sum of TBV growth plus accumulated cash dividends. From 2017 through 2021, the TVC performance of personal-lines-focused mutuals lagged that of publicly traded personal lines insurers by approximately 60%. (See Exhibit 4.) The gap is largely attributable to mutuals’ lower return on equity (4% versus 19% for stock players) and lower annual GWP growth (3% versus 4% for stock players).
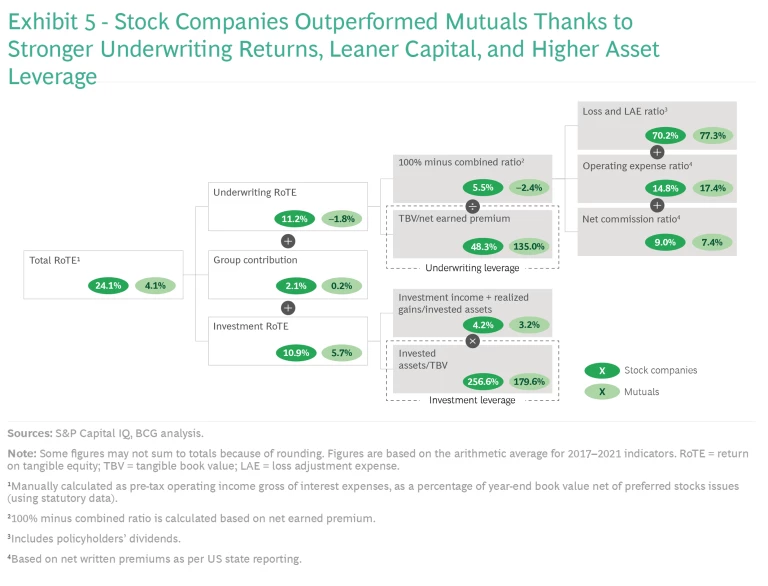
Mutuals’ RoTE is also lower, which our benchmarking shows is a function of three main factors: stock players’ better loss ratio (approximately 7 percentage points lower), better expense ratio (approximately 2.5 percentage points lower), and more efficient capital position reflected in their underwriting and investment
COMMERCIAL INSURERS DELIVER SOLID PERFORMANCE
Commercial insurers had a five-year annual TSR of approximately 10%, supported by rebounding exposures and a favorable pricing environment since late
We have observed interesting dynamics across subsectors:
Specialty-Focused Commercial Insurers. These insurers had a five-year annual TSR of approximately 8%, although with a high dispersion of results across winners and losers. There was an approximately 60 percentage-point gap between top-ranking Kinsale (with a remarkable 48% five-year annual TSR) and the negative TSR of players that performed poorly and have higher exposure to more challenging market segments.
Top-performing insurers focused on segments in which they could sustainably set prices that exceed projected loss cost—taking advantage of favorable tailwinds, strong underwriting discipline, and differentiated capabilities. Many are also leveraging technology to differentiate themselves through lower expenses and improved risk assessment or by delivering a better experience for clients or brokers.
Bottom-quartile specialty performers appear to have been disadvantaged, in part, by a heavy emphasis on less-favorable markets where they were not able to match rate to risk or adequately manage risk concentration. Several bottom-quartile performers reported poor results in their excess and surplus (E&S) portfolio, which may have resulted from overexposure to catastrophe perils and losses over the period studied, especially in property lines. With E&S representing a large and growing share of the US specialty sector, commissions for these lines are above average owing to the multilayered distribution structure that includes wholesalers, retail brokers, and managing general agents (MGAs). This expense profile reinforces the criticality of excellent underwriting to achieve strong returns in these specialty markets.
Nonspecialty-Focused Commercial Insurers. These traditional commercial insurers delivered a five-year annual TSR of approximately 10%, which was the highest among commercial lines. The dispersion of results—approximately 10 percentage points between the top and bottom performers—was much lower than for specialty insurers. Super-regional insurers (such as Selective) performed particularly well, with solid underwriting profitability, manageable natural catastrophe losses, and strong investment contribution.
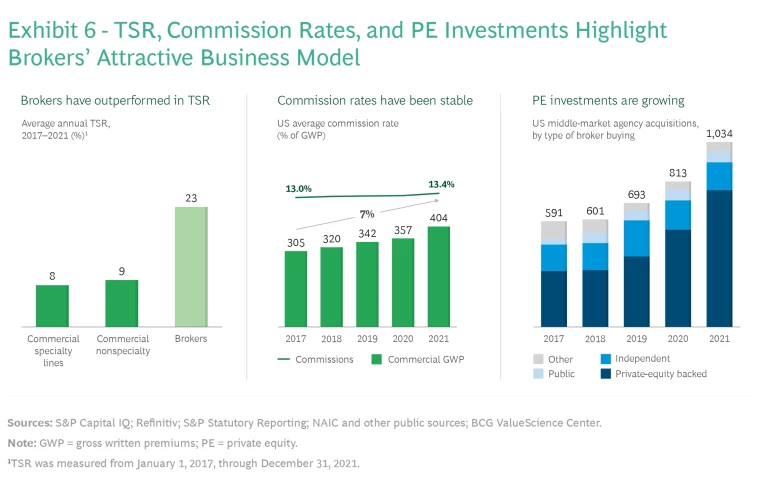
The solid performance of commercial insurers was dwarfed by that of brokerage firms, which had a five-year annual TSR of approximately 23%. (See Exhibit 6.) This might not be a perfect comparison because, in contrast to insurance, brokerage is a capital-light business with minimal balance sheet risk and strong cash-flow generation. However, it is noteworthy that brokerage commissions and fees have remained steady over the years. Proximity to customers and the scale resulting from ongoing market consolidation are important contributors to the strong position of large brokers. They allow brokers to continuously expand their breadth of services and invest in differentiating capabilities, including digital, data, advanced analytics, and technology.
As an indication of brokers’ market strength, private equity (PE) firms have steadily increased investments in brokerage firms over the past decade. In 2021, PE-backed brokers were the buyers in 63% of brokerage acquisitions, up from 34% in 2016. The number of brokerage acquisitions has also grown each year, fueled almost entirely by PE investments.
P&C PLAYERS WITH EVENLY SPLIT PERSONAL AND COMMERCIAL LINES UNDERPERFORM
Finally, players with evenly split books of business across commercial and personal lines (that is, The Hanover and Travelers) delivered a five-year annual TSR of approximately 8%. Compared with insurers that focus on commercial lines, these players had a lower contribution from growth (by 2 percentage points) and a higher contribution from cash flows (by 3 percentage points).
These players’ underperformance relative to the overall commercial and personal lines sectors was not substantial. Even so, it corroborates our view that the greater complexity of their business, including a diversity of clients, distribution channels, and market dynamics, offsets the potential benefits of diversification. We have observed this same trend for multiline insurers over the years in our global Value Creators series.
The Challenges to Long-Term Value Creation
The macroeconomic environment—including the continued impact of COVID-19, extraordinary liquidity injections, supply chain disruptions, and the war in Ukraine—has generated significant headwinds for US P&C insurers. Delivering breakout profitable growth and improving RoTE will become harder as secular challenges still loom while other challenges emerge:
- Upward Pressure on Loss Costs. Claims-related costs are rising in response to upward pressure from a spike in economic inflation, supply chain disruptions, a greater frequency and severity of extreme weather events, and the continued growth of social inflation. Because inflation impacts all aspects of insurers’ business, its effects on value creation are significant. (See “How Inflation Affects Value Creation.”)
- The Growing Power of Intermediaries. Value in the US P&C industry continues to be captured disproportionally by brokers rather than by underwriters. Although the cumulative effect of this long-term trend remains unclear, one must assume that brokers will continue to gradually gain a stronger competitive position. Additionally, insurance services providers, such as third-party claims administrators and technology providers, are also growing profitably.
- Emerging Threats. Climate change and cyber risks present both threats and opportunities. As an example of a threat, commonly used natural catastrophe models do not adequately represent the risk of extreme weather events because of shortcomings in estimating their frequency and severity. As examples of opportunities, cyber insurance rates have been increasing by triple digits over the past quarters and the renewable energy premium globally is expected to double by around 2027.
- Evolving Competitive Landscape. Nontraditional players (such as OEMs and digital marketplaces) and consumer trends (such as digital or hybrid behavior, shared mobility, and sustainability awareness) also pose threats and opportunities.
How Inflation Affects Value Creation
Inflation can be a tailwind for the insurance industry—but only if insurers expect it and appropriately price it in. However, because the industry neither expected the current inflationary spike nor raised rates enough, inflation has negatively affected value creation in recent quarters. Required rate adjustments vary widely by line: in personal lines, rate hikes are accelerating significantly, while in commercial lines, the current environment could further prolong the hard market.
Inflation affects many components of P&C insurers’ income statements and balance sheets in the short and long term, and its impact differs by line of business. For instance:
- In short-tail property lines, loss costs are heavily affected by economic inflation because the cost of materials and wages are the main drivers of claims costs. Current forecasts suggest that inflation will negatively affect these drivers through 2022 and well into (if not beyond) 2023. The adverse financial results reported for 2021 and 2022 indicate that short-tailed lines have already been affected. Personal insurers, for instance, are filing rate increases. Commercial property insurers are adjusting prices and restricting terms, conditions, and limits, which could prolong the hard market cycle.
- In longer-tail liability lines, loss costs are less heavily indexed to economic inflation and most heavily influenced by wage, medical, legal, and social inflation. Inflation mainly affects the balance sheets of long-tail lines. Prolonged inflation could create significant risks to the reserving positions that underpin long-tail lines.
To maintain resilience and sustain value creation in the face of these threats, insurers must act quickly to understand the vulnerabilities within their portfolio. Potential responses include improving pricing nimbleness by increasing the frequency of rate adequacy reviews and state-level rate updates; accelerating cost transformation programs to achieve productivity-related reductions in the expense ratio; and minimizing claims leakages by managing repair shop networks, ensuring efficient claims adjudication, and improving fraud detection.
Four Imperatives for Profitable Growth
In this uncertain environment, we see four imperatives to promote the profitable growth of US P&C insurers.
AGGRESSIVELY PURSUE EFFICIENCY
Rising inflation has created an urgent need for step-change productivity improvements. Transaction costs are an excessive burden to the industry and unsustainable. Today, for every dollar of P&C premium, insurers use $0.30 to $0.35 to cover expenses, about two-thirds of which are driven by distribution costs and the remainder by general and administrative expenses. Moreover, SG&A costs relating to an insurance policy have been relatively stable for a decade, while in many other industries technology has unlocked massive productivity gains.
Insurers and technology providers are developing point solutions to rescale the industry’s cost curve. Among such solutions are robotic process automation (RPA) and artificial intelligence (AI) , such as using chatbots in first notices of loss, AI for fraud prevention, and aerial imagery in the underwriting process for homeowners insurance. Deploying RPA and AI across the insurance value has already lowered costs by 30% to 50% in targeted applications. However, despite promising examples of success, the industry still has not meaningfully altered its cost curve.
Deploying robotic process automation and AI can help P&C insurers lower costs.
In the US auto insurance market, the two carriers that have captured a disproportionate share of the new business—Geico and Progressive—have an expense advantage of approximately 12 and 6 percentage points, respectively, versus the industry average. In a market with narrow underwriting profits and heightened inflationary pressures, only the fittest can be price competitive and drive superior growth.
Efficiency also tends to be highly correlated with agility and speed. Appropriate scale in specific markets (rather than overall company size) and speed are key competitive advantages. For P&C players, this makes determining the minimum efficient scale to compete in each line of business an important strategic consideration as they seek to become nimbler.
Incumbents should aggressively reduce their cost profiles to remain competitive. This includes adopting a “bionic” operations model to deploy new technologies as well as data and analytics solutions to augment the productivity of employees across the organization, from underwriting and claims handling to customer service. They also must embrace digitally enabled distribution models and tap into new platforms to reduce distribution costs. Mastering the economics of “cost of acquisition” and “customer lifetime value” in different channels will be essential.
EMBRACE EMBEDDED INSURANCE AND ECOSYSTEMS
Embedded insurance—that is, insurance integrated with third-party products and services—is rapidly expanding beyond deliveries, events, travel, and other traditional areas. It now encompasses a broad set of opportunities in auto and mobility, home, retail and commerce, vacation rentals, ridesharing, data protection, and more. Industry estimates suggest embedded insurance could represent up to 25% of the US P&C insurance market over the next decade, generating revenues of approximately $100 billion.
Incumbent insurers aren’t alone in being attracted to these new distribution models with attractive unit economics. They have also the gained attention of MGAs, OEMs, and big tech firms. Even insurtechs are pivoting from an initial direct-to-customer focus and aiming to become bigger players in the space. For example, Root has partnered with e-commerce platform Carvana to enable insurance purchasing at the point of sale. Such efforts are generating returns. For instance, Hippo estimates that partnerships with mortgage originators and home builders drive 25% of its distribution, and Branch reports that its embedded customers have an 80% higher lifetime value than direct-channel customers.
Embedded insurance is rapidly expanding beyond deliveries, events, and other traditional areas.
To win in these new ecosystem platforms, it is not enough to offer the same product in a new channel. Rather, winners offer a differentiated value proposition and seamless customer experience. In many cases, this leads insurers to provide their differentiated offering through E&S lines to take advantage of the “freedom of form and rate” available in the non-admitted market.
A modern technology architecture, based on microservices and APIs, is essential for insurers to effectively connect with new ecosystem partners, assess risks appropriately, and conduct instant quoting and binding in the platform. Success also requires having a sleek customer interface, an effective engagement model, value-added solutions that relieve customer pain points, new data and technology, and novel approaches to pricing and underwriting. Finding the right partners—those that have many customers, are trusted brands, and are willing to share data—is critical. To be better positioned to capture value with partners, insurers should closely examine their capabilities, operating model, and mindset when creating their ecosystem strategy.
FUTURE-PROOF THE BUSINESS FOR CLIMATE CHANGE
When it comes to climate change, there are both threats and opportunities for the P&C insurance industry. Global warming is expected to exacerbate extreme weather events, such as droughts, wildfires, and hurricanes, threatening the stability of major property insurance markets. For example, if Florida experienced two consecutive years of natural catastrophes as destructive as the state endured in 2017, property insurance capacity would be structurally reduced.
Already, commonly used natural catastrophe models, built on historical data, may not adequately represent the risks, especially in certain prone areas. Even though property insurance rates are hardening, carriers are gradually withdrawing capacity in Florida and other coastal areas and California and other areas most impacted by droughts and wildfires. There is wide recognition that public insurance programs, such as state-chartered “wind pools,” have been insufficient to stabilize crucial markets experiencing challenges. Rather, some experts argue that these programs actually accentuate market distortions.
Carriers can take a variety of defensive actions in response to the threats. For example, they can update weather-related claims modeling to factor in new and more accurate data sources that capture the expected higher impact of natural catastrophes. Model adequacy can become a differentiator in a fast-changing risk landscape. Carriers might also develop resilience services and solutions to help clients and communities become better prepared for extreme weather.
On the opportunities side, insurers can write new business to support the transition to clean energy. Over the next 20 years, governments and companies will need to invest more than $100 trillion to meet the COP26 goal of limiting global warming to 1.5°C above the preindustrial levels.
P&C insurers have a critical role to play in the transition to clean energy.
P&C insurers have a critical role to play in this energy transition. As major institutional investors managing more than $5 trillion of assets, they can embed sustainability criteria in their investment decisions to support a greener economy. They can also develop capabilities to capture a larger share of the new green investments, such as in solar panels and the construction and operation of on- and offshore wind turbines. As underwriters, they will need to evolve their risk appetite to participate in the growth opportunities in a greener economy and mitigate the slow (albeit certain) shrinking of their traditional energy portfolios.
Additionally, insurance carriers should adapt their own operations to the new sustainability standards, in response to the rising demand from multiple stakeholders. For example, the US Securities and Exchange Commission has proposed requiring public companies to provide detailed reporting of their climate-related risks, emissions, and net-zero transition plans.
STRIVE FOR UNDERWRITING EXCELLENCE
For many years, the industry’s profitability has been challenged by increased competition from growing incumbents as well as new market entrants. Excess capacity has dampened technical returns. During the past 2.5 years, rate hardening in commercial lines has provided carriers with some temporary relief. However, significant uncertainty is looming as high economic inflation and persistent social inflation show no signs of abating.
Higher cost of goods sold, increasing property values, and labor shortages are hurting carriers. With the earn-through of rates lagging loss trends by 6 to 12 months, there is no conclusive evidence that the recent cycle of rate increases will be sufficient to withstand rising costs. Further, higher loss costs may be exacerbated by regulatory resistance to rate increases in some states. Concurrently, in liability lines, carriers still face the threat of social inflation. This is driven by more “nuclear verdicts” (jury awards that exceed $10 million) and elevated litigation levels. (In 2021, the third-party litigation market was estimated to be approximately $17 billion.)
The leaders identify which markets will enable profitable growth and define a strategy for delivering it.
Along with rising pressures from climate change, these trends are compelling carriers to refocus on the core competency of underwriting. Even more than expense efficiency, strong performers have delivered exceptional and stable loss ratios over the years. This has allowed them to build a combined ratio advantage of approximately 20 percentage points over their bottom-quartile competitors.
As a core competency, P&C insurers can pull different levers across the underwriting journey to build excellence, including:
- Products. Carriers can review and rationalize product offerings to refocus on more profitable products. They can also increase cross-selling and upselling to better amortize acquisition costs and improve customer retention and lifetime value.
- Risk Selection and Pricing. Implementing advanced modeling and leveraging AI (for example, machine learning) allows carriers to manage both technical and market pricing. By developing advanced analytics techniques for triaging submissions, they can enhance their abilities to distinguish high-touch from lower-touch risks.
- Distribution. By implementing an effective coverage model, carriers can strengthen broker relationships and promote demand for preferred business. In addition, developing integrated portals can streamline business placements and centralize account-level information.
- Portfolio Management. Carriers can reassess the risk framework to optimize capital allocation, reprioritize growth areas, and achieve stronger risk-adjusted returns. This is true for commercial lines insurers that have a broad portfolio with respect to regions (within and outside the US), lines of businesses, and customers (multinationals, middle market, and small businesses). It also applies to personal lines insurers—for example, with respect to their concentration in states that are highly exposed to weather events or have more challenging regulatory frameworks.
For US P&C insurers, outperformance in the current macroeconomic environment demands nothing less than a laser focus on profitable growth. Although the US P&C industry has performed well, the value creation gap between top and bottom performers is enormous. Our study makes clear that profitable growth sets apart the leaders from the laggards. The leaders identify which markets will enable profitable growth and define a strategy for delivering it. It’s time for the laggards to follow suit.
Appendix: First and Second Quartiles of US P&C Insurers’ TSR Returns
The authors thank their BCG colleagues Juergen Bohrmann, Merritt Moran, Filippo Novella, Rachna Sachdev, Teresa Schreiber, Pablo Segovia Smith, and Alex White as well as Ted Bonanno and Martin Link of the BCG ValueScience Center.

