
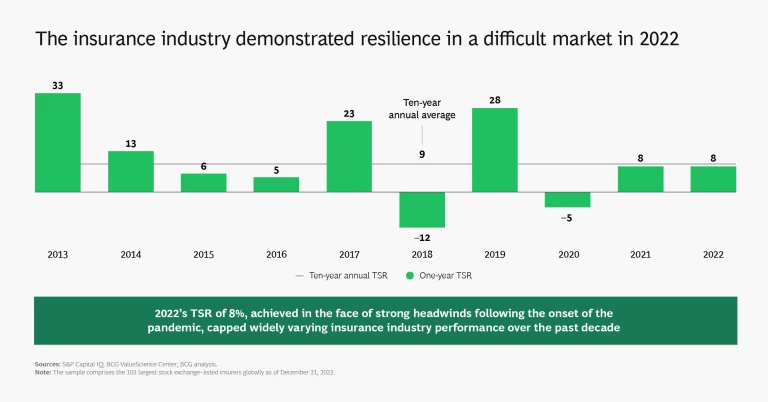
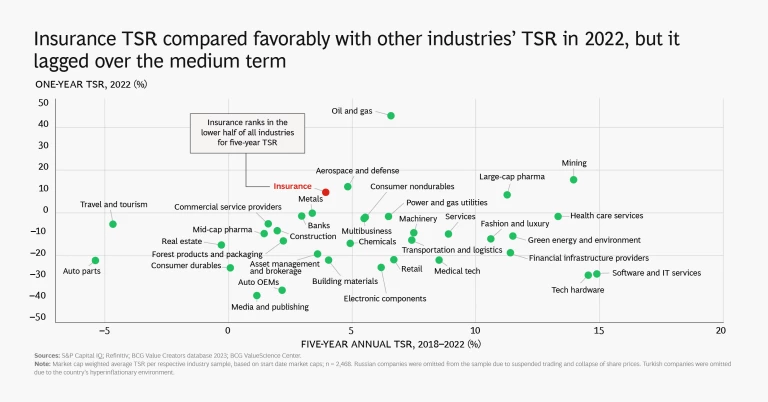
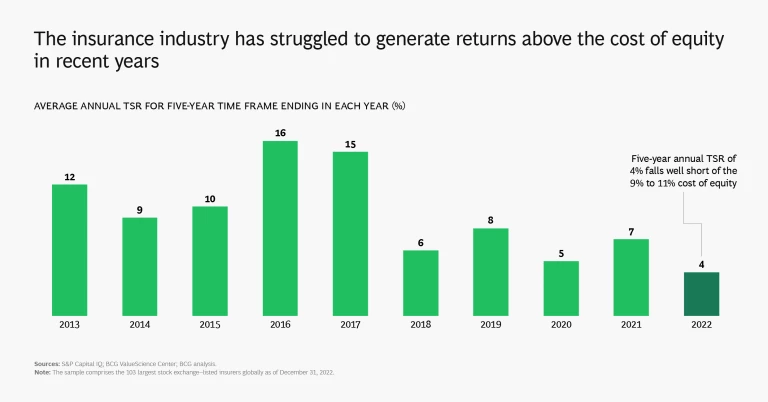
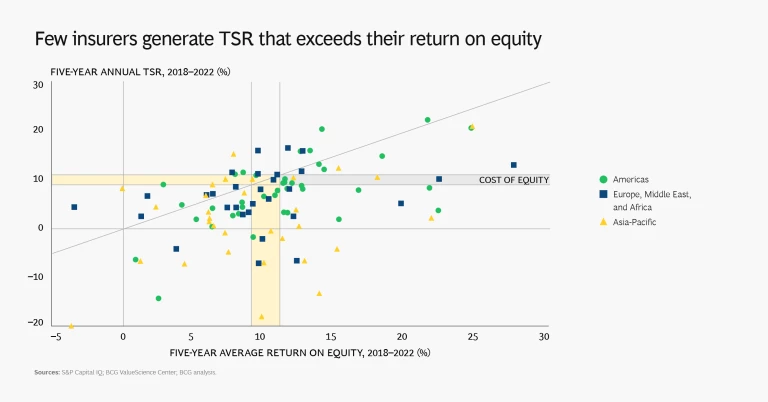
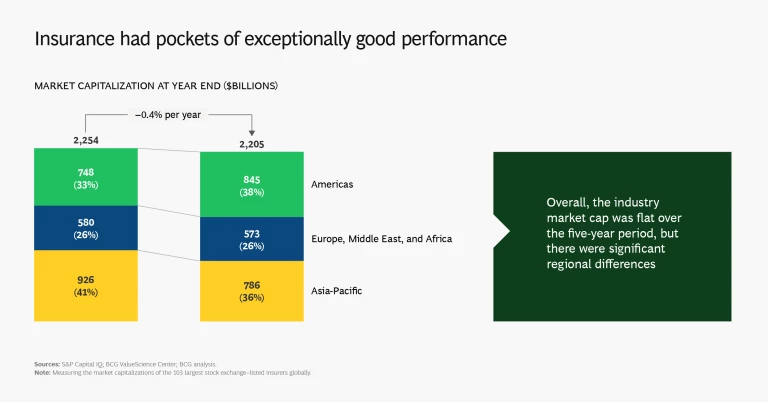
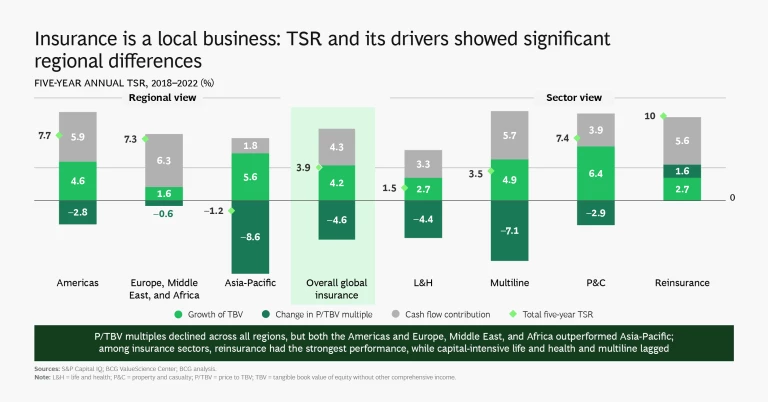
When it comes to value creation, as measured by total shareholder return (TSR), the global insurance industry has had a tough time since the onset of the pandemic. The industry’s 2022 one-year TSR of 8% exceeds that of most other industry sectors, demonstrating admirable resilience, but it nonetheless falls short of meeting investors’ cost of equity, continuing a trend of recent years. The five-year annual TSR for insurance from 2018 through 2022 is an underwhelming 3.9% and compares with an all-industry average of 6.6%. The global insurance industry's market capitalization remained stagnant at about $2.2 trillion over this period.
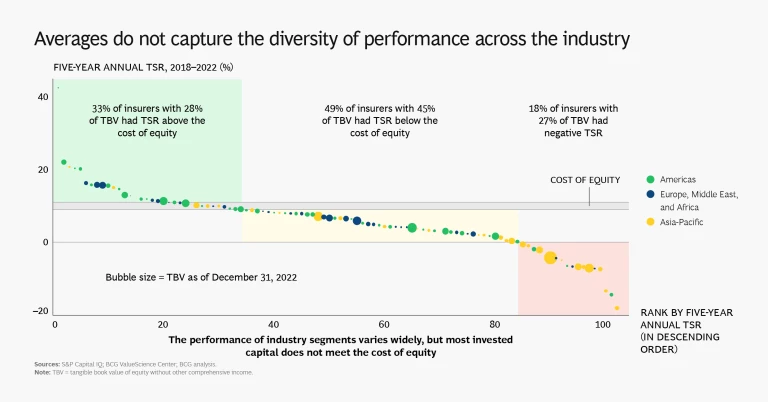
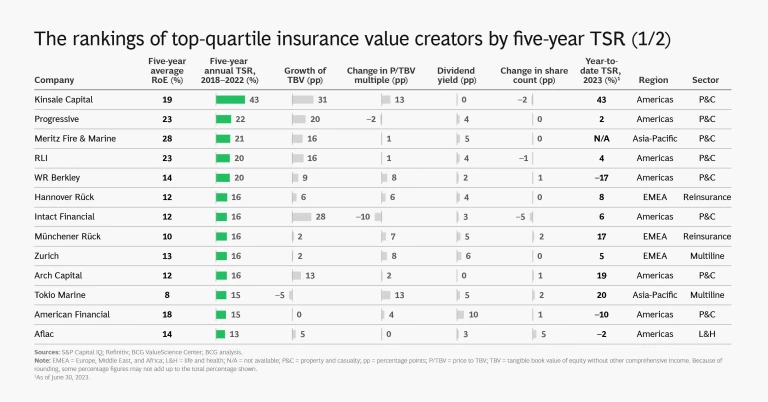
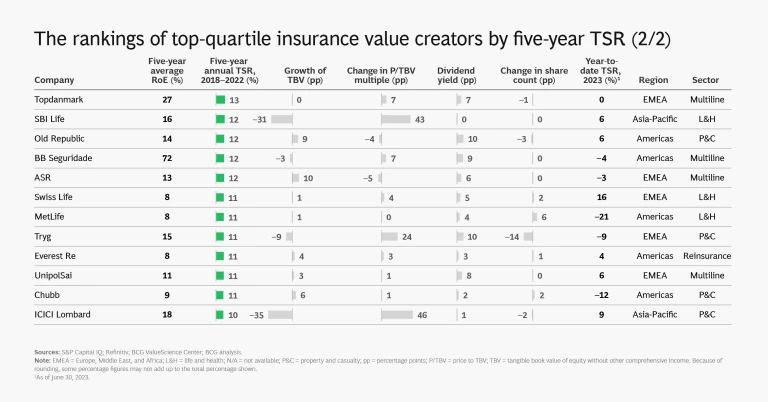
As we pointed out in last year’s insurance value creator’s report , though, averages do not tell the full story. Five-year TSR varies widely, both geographically and by industry segment, with a range of more than 40% to –20% for individual companies. But overall, only 33% of insurers delivered TSR that was greater than the cost of equity, and 18% had negative TSR. (See “About the 2023 Insurance Industry Research.”)
About the 2023 Insurance Industry Research
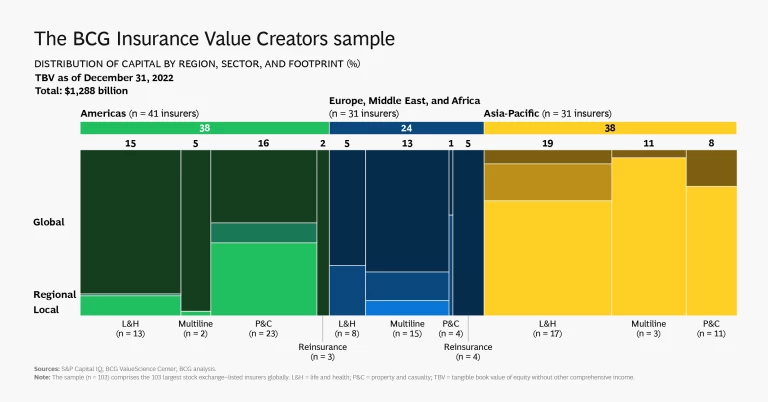
The 103 companies break down as follows:
- Region: 41 are based in the Americas; 31 are in Asia-Pacific; and 31 are in Europe, the Middle East, and Africa.
- Sector: 38 focus on life and health insurance, 38 specialize in property and casualty, and 20 operate in multiple lines. Seven are purely or primarily reinsurers.
- Footprint: 45 operate primarily in their home market, 17 regionally, and 41 globally.
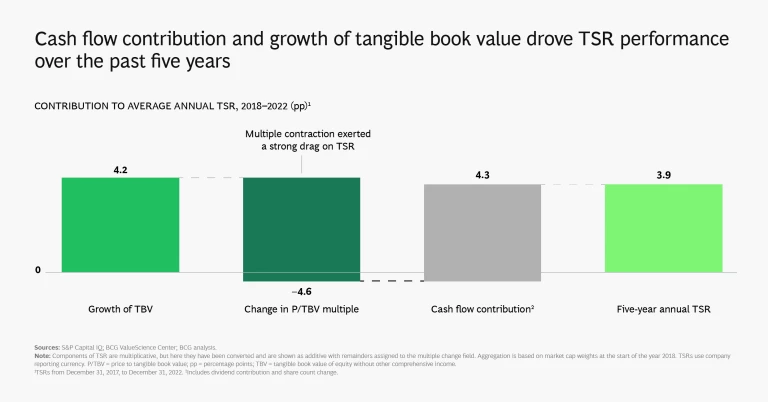
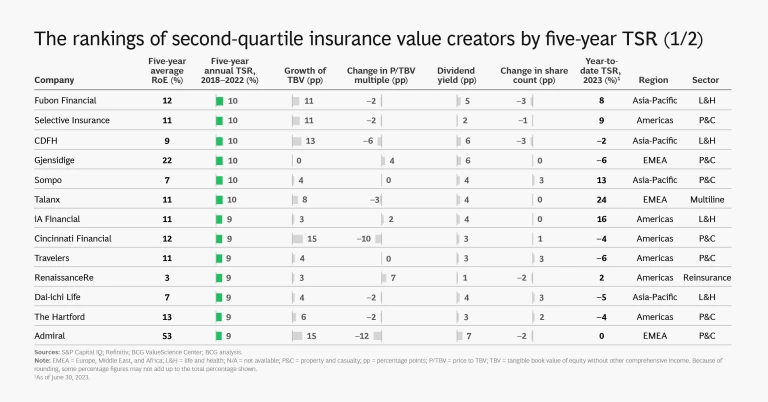
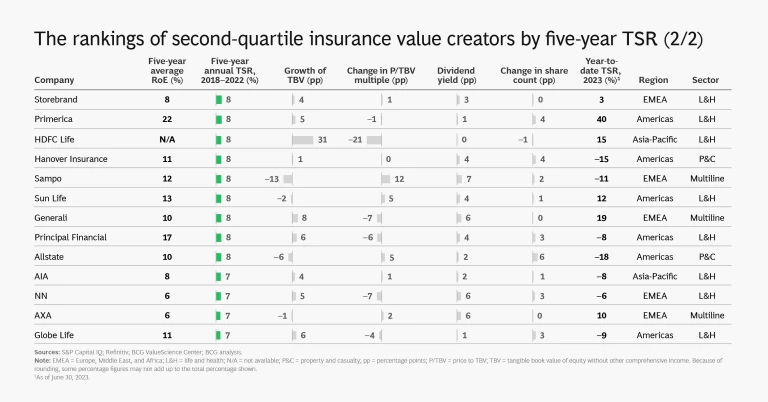
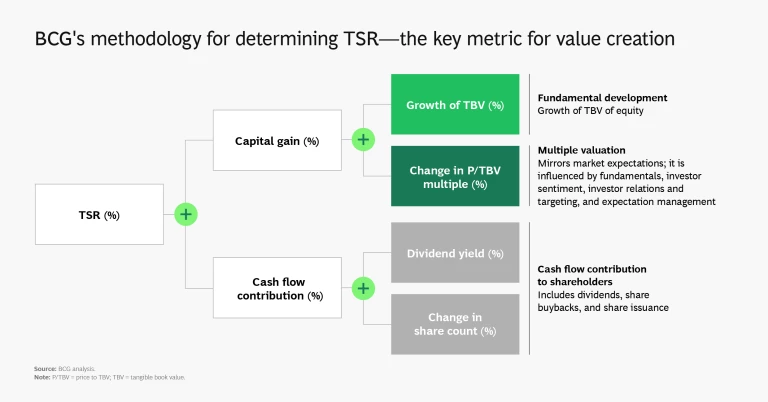
Calculating TSRs is a straightforward matter of combining share price gains and dividends. More interesting is the process of disaggregating insurance TSRs into their three components:
- Growth in tangible book value (TBV)
- Change in price to tangible book value multiple (P/TBV)
- Contribution from cash flow (comprising dividend yield and share count change effects)
We base our analyses on data from S&P Capital IQ and Refinitiv. Given the large valuation variances in the first half of 2022 that resulted from interest rate movements, we adjusted the TBV for other comprehensive income, which we believe allows us to derive more meaningful insights into how TBV variances affect TSR over time.
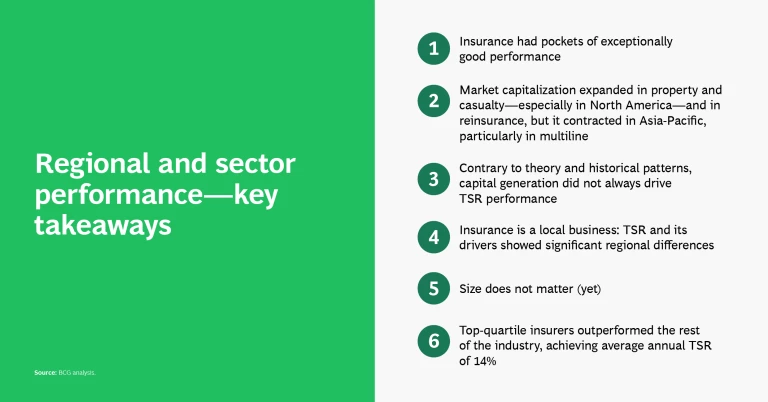
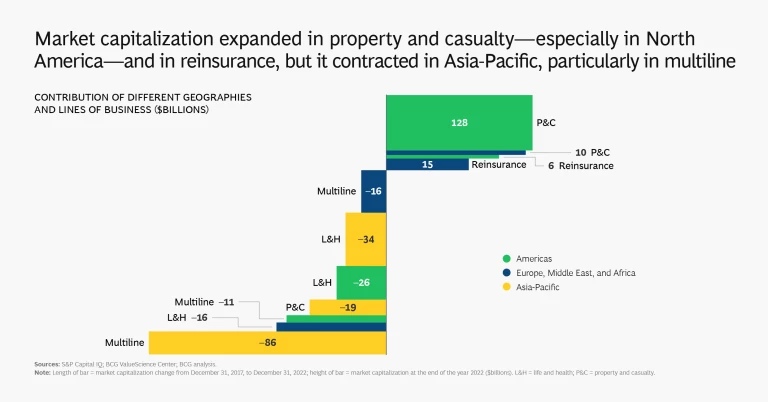
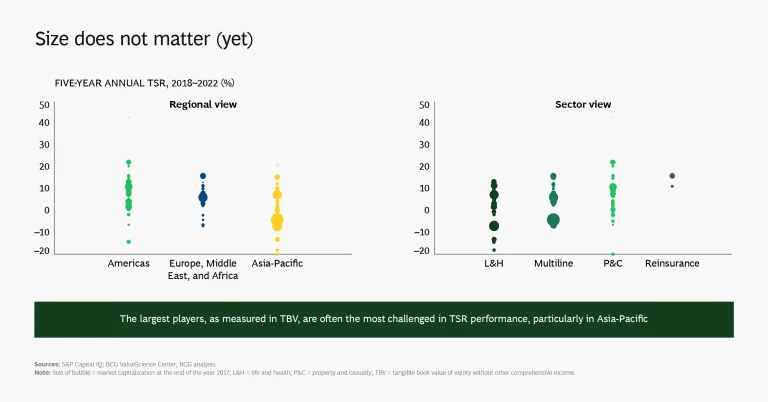
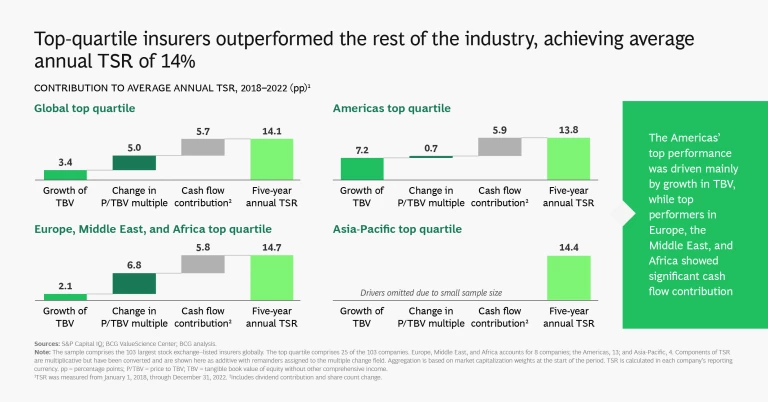
The Americas (predominantly the US) saw the strongest TSR performance across the three regions, led by particularly strong performance in its property and casualty (P&C) sector, whose market capitalization expanded by 13%. Market capitalization dropped by 15% in Asia-Pacific and was broadly flat in Europe, the Middle East, and Africa. Almost all of the expansion of market capitalization in the US was concentrated in the P&C segment, which increased by 37%.
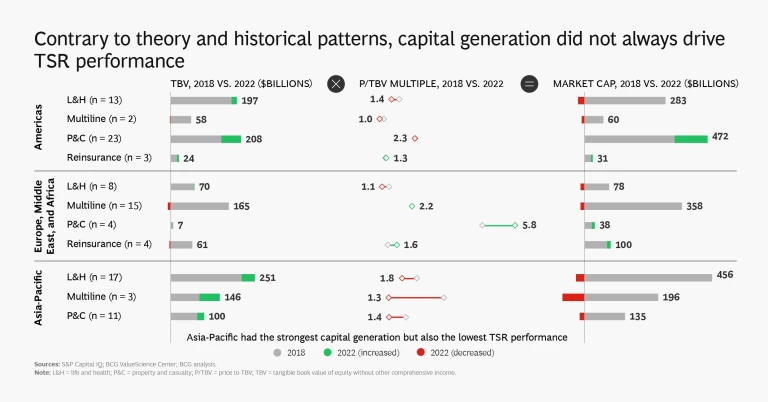
While Asia-Pacific saw the greatest amount of capital generation (and about two-thirds of global capital generation), the region’s TSR disappointed because of a material drop in market capitalization stemming from a broad-based decline in price to tangible book value (P/TBV) multiples. Asia-Pacific multiline insurers, a segment concentrated in a few large players that saw significant repricing of their shares, were responsible for much of the decline. Book value growth and cash flow are the chief contributors to TSR over the long run, but changes in the P/TBV multiple matter a lot more in the short to medium term.
Overall, insurers in Europe, the Middle East, and Africa stagnated, with low or negative capital generation and modest changes in TBV. TSR came primarily from cash contributions. We saw a TSR polarization in this region, as P&C and reinsurance expanded at levels similar to the Americas (albeit at lower scale) while the market caps of life and health companies dropped by 17%.
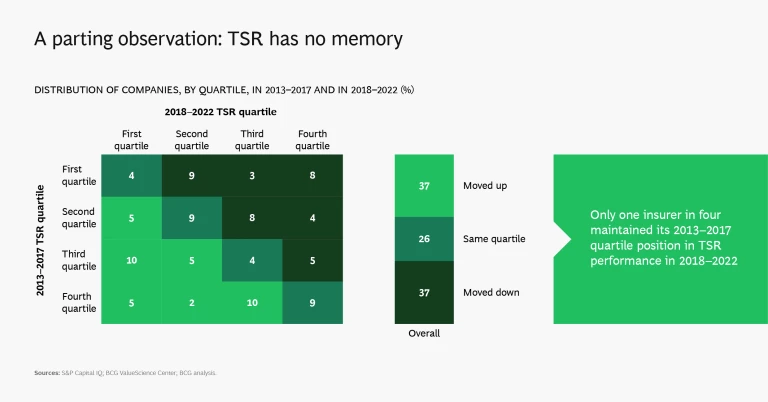
The insurance segment that performed best globally over the past five years is also the smallest in terms of TBV: reinsurance, which produced annual TSR of 10%. Industrywide, relative TSR performance across companies fluctuated strongly over the past ten years. Only 16% of the companies in the top quartile during the period from 2013 to 2017 maintained their position in the years from 2018 to 2022; four out of five fell into the second, third, or fourth quartiles.
The good news for companies that fell is that TSR has almost no memory, so they have the opportunity to rebound. Those at the top, meanwhile, are under greater pressure to maintain their position.
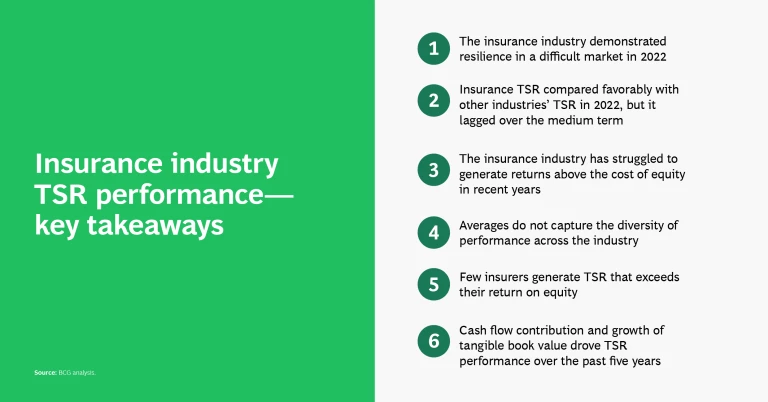
The following slide show provides a detailed look at the insurance industry’s 2018–2022 TSR story.


The authors are grateful to Martin Link, Felix Tam, Ted Bonanno, Teresa Schreiber, and Nitish Suddhoo for their assistance with this year’s research and report.