


Global capital markets have been on a remarkable journey over the past 25 years. And BCG’s Value Creators rankings have tracked performance every step of the way. Since 1999, BCG has published annual rankings of the world’s top value creators based on total shareholder return (TSR) over the previous five-year period.
To mark the rankings’ 25th anniversary, we reviewed a quarter-century of value creation patterns across industries and regions. Our key observation: being present in attractive markets is important, but secular tailwinds alone are usually insufficient for outstanding long-term TSR performance. What sets long-term value creators apart is their ability to capitalize on favorable conditions and weather less favorable ones through innovation that differentiates their products and services. This often involves disrupting their own near-term success so that they can stay ahead of existing or potential competitors over the long run.
What sets long-term value creators apart is their ability to capitalize on favorable conditions and weather less favorable ones through innovation that differentiates their products and services.
Before delving into our 25-year rankings, we highlight key points from the current five-year rankings detailed in our 2023 Value Creators interactive .
Five-Year TSR Shows Shifting Patterns
The current five-year rankings are based on average annual TSRs from 2018 through 2022—a period that included a wide range of market conditions.
Global capital markets achieved an average annual return of approximately 7% in this five-year period. This annualized return is consistent with long-term historical returns, despite the Q4 2018 market correction, the impact of the COVID-19 pandemic, and 2022’s inflation-driven market headwinds. However, it is notably lower than the double-digit returns achieved during the bull market that characterized most of the 2010s and extended through 2021—for example, the annualized return of the S&P Global 1200 index was 13% per year from 2011 to 2021.
The significant market headwinds in 2022 materially shifted value creation patterns across regions and industries:
- Companies in Asia-Pacific made considerable gains in the rankings, primarily at the expense of those in Europe and North America. Indeed, Asia-Pacific companies are now disproportionately represented among the top-performing companies worldwide. They represent more than 50% of the global top 100 value creators and are the largest group among companies ranking in the top ten of their respective industries.
- The deceleration in technology-driven value creation, initially observed in our 2022 Value Creators report , became more pronounced in 2022. Software, hardware, medtech, and fintech companies were among those seeing the most significant TSR slowdown. At the other end of the spectrum, the TSRs of oil and gas companies spiked substantially in 2022. (See Exhibit 1.)
- Over the past five years, large-cap biopharma and mining companies have most consistently demonstrated strong performance. On the other hand, industries that rely on significant consumer spending have faced the most consistent challenges with respect to TSR. These include automotive (OEMs and suppliers), consumer durables, and travel and tourism.

While US-based companies, which are often technology-driven, stand out as the world’s most valuable firms, the five-year rankings of leading value creators (for large-cap companies and overall) have become much more diverse:
- The top-ten large-cap value creators include leading companies in technology (for example, Advanced Micro Devices, ASML, Apple, and Tesla) and biopharma (Eli Lilly and Novo Nordisk), as well as other global industry leaders (such as Hermès, Petrobras, Vale, and Al Rajhi Bank).
- In contrast, the top-ten value creators among all companies include only three US companies but six from Asia (including three Chinese firms). Nine of the ten companies are in technology-related sectors, including three green-energy firms focused on solar power.
An Overview of 25-Year TSR Performance
Since the first BCG Value Creators report was published, 25 years ago, global capital markets have yielded an annualized return of approximately 9%. They have delivered this strong return despite four major crises—the 2000–2001 bursting of the dot-com bubble, the 2008–2009 Great Financial Crisis, and the 2020 COVID-induced dip, and the 2022 bear market.

Across industries, the median 25-year TSR performance appears quite diverse. Top-performing sectors include health care services, fashion and luxury, fintech, software, mining, machinery, and retail. (See Exhibit 2.)
We also see several noteworthy aspects of regional performance:
- India stands out as the top-performing capital market, with an almost 15% annualized return and featuring 10 of the top 25 overall TSR performers.
- Among developed markets, the US and Australia are the strongest performing, with annualized TSRs of 7.6% and 8.7%, respectively. The UK and Germany rank among the lagging regions, with annualized TSRs of approximately 5% each.
- The robust performance of the US capital market is also evident in the presence of 10 US-based firms in the large-cap top 25 rankings, followed by India (5 companies), and China and France (2 each). (See Exhibit 3.)
The large-cap top-25 rankings for the past quarter century include several distinct groups of long-term value creators:
- Innovation leaders in technology (for example, Apple, Amazon, Infosys, Samsung, ASML, Adobe, Intuit, and Qualcomm) as well as in biopharma (for example, CSL, Gilead, Regeneron, and Novo Nordisk).
- Companies that were able to develop new markets and new business models in health care services (for example, UnitedHealth Group) and consumer-facing sectors, such as food and beverage (for example, Monster Beverage), fashion and luxury (for example, Fast Retailing, Uniqlo’s parent; Hermès; and Dior), as well as retail (for example, O’Reilly Automotive, Couche-Tard, and Tractor
Supply1 1 Tractor Supply is not included in the large-cap ranking because of its size. It would rank in the top five if it met the market capitalization threshold. ). - Emerging market champions in banking (HDFC Bank and ICICI Bank), beverages (Shanxi Xinghuacun Fen Wine Factory and Luzhou Laojiao), and materials (Vale and Reliance).

The returns generated by the large-cap top performers are truly impressive. Even the “weakest” of these companies returned 17% annually, resulting in a more than 50-fold increase in value over 25 years. By comparison, money invested at the overall 9% market return achieved an 8-fold increase in value over this period. These companies’ long-term outperformance is especially impressive because no company is able to beat its industry and regional benchmarks every year. (See the sidebar, “The Challenge of Consistent Value Creation.”) The companies at the top of our long-term value creators ranking have found ways to overcome the gravity that pulls most companies’ TSRs back to average.
The Challenge of Consistent Value Creation
The Challenge of Consistent Value Creation
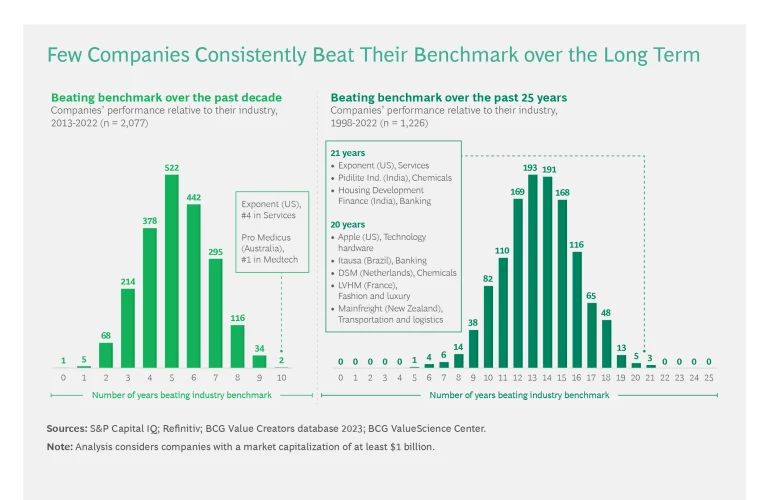
This clearly highlights how difficult it is for companies to consistently outperform. Fortunately, top performers do not need to beat the market each and every year. What they typically have in common is consistently strong performance (above average more often than not), including resilient share prices during downturns. In contrast, bear-market headwinds often are the main reason why less fortunate companies cannot sustain strong long-term TSR performance.
How Long-Term Value Creators Excel
The distinct groups of top long-term value creators highlight that there is more than one path to strong and sustainable long-term TSR. Although each of these companies was able to develop its individual path, growth was essential for success. To promote growth, long-term value creators generally draw on two key
strategy drivers
:
- Playing in the right markets. Most top value creators benefit from market tailwinds and the growth opportunities they present. While some companies were fortunate to start out in the right markets, many expanded into promising new market segments over time. Well-known examples of companies making such moves include Amazon (web services), Apple and Samsung (smartphones), Adobe (software as a service), and UnitedHealth Group (managed health care). Most important, many of these companies were not afraid of disrupting their existing businesses to pursue such new opportunities.
- Competing through differentiation and innovation. Leading companies sustain value creation by building and protecting strong market positions through differentiation and innovation. Their approaches, of course, differ substantially. But the common thread is that they identify durable and scalable strategies that allow them to penetrate markets globally (for example, Monster Beverage and Fast Retailing), become regional champions (for example, HDFC Bank, ICICI Bank, and Tractor Supply), or expand their footprint in focused markets (for example CSL and Couche-Tard).
Our 25-year retrospective highlights that exceptional companies can consistently create outstanding shareholder value over time. Compelling value creation strategies have turned volatility and downturns that were catastrophic for other companies into mere bumps in the road for these perennial value creators. The next quarter century will undoubtedly feature many ups and downs in the macro-economic, business, and capital-market environments. Companies employing the right approaches to identify promising markets and stay ahead of the competition will be well-positioned for sustained long-term value creation , regardless of what the future brings.
To explore the value creators reports through the years, visit our Collection page .
Methodology
Methodology
We eliminated companies that either were not listed on a world stock exchange for the full five years of our study or did not currently trade at least 20% of their shares in public capital markets. We allow exceptions to this rule for companies that are regarded as key industry players. In addition, we eliminated companies for which five-year TSR was distorted by exogenous factors, such as speculative trading not based on fundamentals. We also eliminated companies that are headquartered in Russia or have predominantly Russian operations. Finally, we eliminated Turkish companies because the country’s hyperinflationary environment skews valuations.
We further refined the sample by organizing the remaining companies into 35 industry groups and by establishing an appropriate market-capitalization hurdle to eliminate the smallest companies in each group. (We identify the size of the hurdle for each industry in the interactive.)
Our global large-cap ranking focuses on the top 50 companies among the 200 largest companies by market capitalization. We based the global and industry rankings on five-year average TSR performance for the individual companies, from 2018 through 2022. TSRs and the contributing financial metrics are based on a company’s reporting currency.
In addition, for all but four of the industry rankings, we divided TSR performance into the six investor-oriented financial metrics that BCG’s TSR disaggregation model uses: sales growth, margin change, multiple change (EBITDA), dividend yield, change in the number of shares outstanding, and change in net debt.
For four industries—asset management and brokerage, banking, insurance, and real estate—we used a slightly different approach to TSR disaggregation because of the special analytical problems involved in measuring value creation in those sectors. For asset management and brokerage and for real estate, equity growth replaces sales growth, return-on-equity change replaces margin change, and the price-to-earnings multiple replaces the EBITDA multiple. Change in net debt is not shown. For banking and for insurance, equity growth replaces sales growth, and the price-to-book multiple replaces the EBITDA multiple. Margin change and change in net debt are not shown.
The interactive and article reflect the rankings of companies in our 2023 database and do not include companies that dropped off the list prior to 2023 as a result of mergers, bankruptcies, or other events. For that reason, the rankings from previous Value Creators reports may be slightly different.
Sources: S&P Capital IQ; Refinitiv; BCG ValueScience Center.
Note: Market capitalization of equity is shown as of December 31, 2022. The location shown is of the corporate headquarters. The contribution of each factor in the TSR disaggregation to the five-year average TSR is shown in percentage points. Dividend yield may include cash dividends, special dividends, proceeds from spinoffs, other extraordinary payouts and adjustments for share splits, issuance of bonus shares, or other one-off events. Although disaggregation is multiplicative, it is converted and shown here as additive, with remainders assigned to the margin and multiple change fields. Because of rounding, the numbers may not add up to the TSR figure shown. Share change refers to the change in the number of shares outstanding, not to the change in share price. Net debt change refers to the change in market capitalization relative to the change in enterprise value, and it includes the change in debt and cash.
Disclaimer: The materials contained in the interactive and article are designed for information purposes only. BCG does not provide fairness opinions or valuations of market transactions, and these materials should not be relied on or construed as such. A company’s inclusion in the ranking does not represent an endorsement by BCG. The interactive and article do not provide investment or financial advice. Users should contact their advisor to receive such advice.
BCG has used publicly available data. BCG has not independently verified the data and assumptions used in these analyses. BCG has made no undertaking to update these materials after the date they were gathered for publication, after which such information may become outdated or inaccurate. Changes in the underlying data or operating assumptions will have an impact on the analyses and conclusions. The underlying model used for the interactive and article is designed to work across industries and is no replacement for a detailed calculation that accommodates company- or industry-specific adjustments, which may have an impact on the accuracy of the results.