Mexico’s listed companies have shown that it is possible to create value across sectors regardless of broader macroeconomic trends. From 2017 to 2022, some companies were able to navigate headwinds and deliver outstanding returns to shareholders.
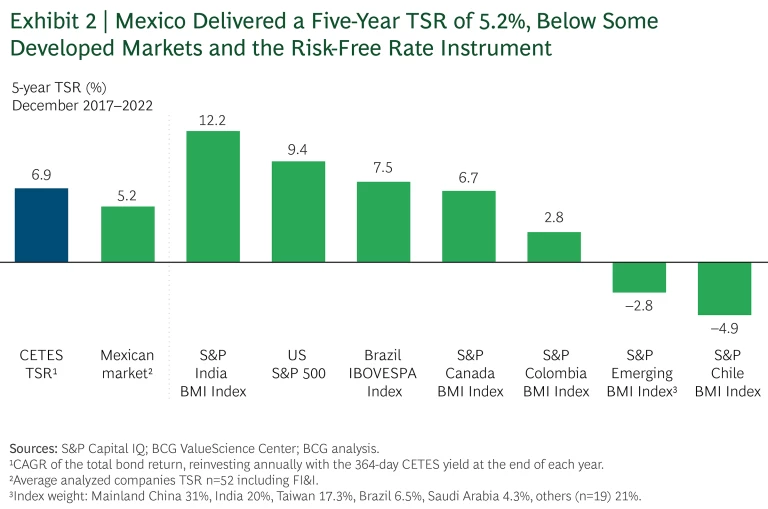
Our first value creators study of the Mexican market reveals an average five-year TSR of 5.2%, higher than that of other emerging-market indexes such as the S&P Colombia BMI, S&P Emerging Markets BMI, and S&P Chile BMI. But Mexico still lags the TSR of Mexican Federal Treasury Certificates (CETES) as well as other developed and emerging countries. (See “Methodology” for more details on our analysis.)
Methodology
TSR
TSR measures the combination of capital gains and free-cash-flow contribution (the dividend yield and change in the number of shares outstanding) for a company’s stock over a given period. We analyze TSR to assess the overall value created for shareholders. It is the most comprehensive metric for gauging a company’s shareholder value creation performance.
We disaggregated TSR performance into four investor-oriented financial metrics: revenue growth, change in margins, change in valuation multiple, and cash flow contribution. Each of the four financial metrics had equal weight in the aggregated TSR. We used price-to-earnings ratio for financial institutions and insurers and enterprise value-to-EBITDA for the other industry sectors owing to their capital structures. Our analysis included five-year average annual TSR disaggregation.
Selected Companies
We analyzed value creation for 52 companies. To arrive at this sample, we began with data provided by S&P Capital IQ that covers approximately 24,000 companies. We eliminated those that were not listed on a world stock exchange for five consecutive years. We included only Mexican listed companies with a market cap of at least US$1 billion, which covers the companies with the highest trading volume. We excluded FIBRAs (Mexico’s real estate investment vehicles) owing to their regulations and fiscal requirements, such as their dividend contribution policy. We further refined the sample by organizing the companies into seven industry sectors. The sectors were financial institutions and insurers, transportation and infrastructure, consumer packaged goods, industrial goods, retail, conglomerates, and technology, media and entertainment, and telecommunications. Our small-cap cut comprised companies with a market cap of less than US$3 billion, for a total of 27 companies. Our mid-cap cut consisted of companies with a market cap of US$3 billion to US$8 billion, a total of 13 companies. Our large-cap cut was made up of companies with a market cap of more than US$8 billion, a total of 12 companies.
Sources: S&P Capital IQ; BCG ValueScience Center.
Note: Market cap of equity is shown as of December 31, 2022. The location shown is of the corporate headquarters. The contribution of each factor in the TSR disaggregation to the average annual TSR is shown in percentage points. Dividend yield may include cash dividends, special dividends, proceeds from spinoffs, other extraordinary payouts and adjustments for share splits, issuance of bonus shares, or other one-off events. Although disaggregation is multiplicative, it is converted and shown here as additive, with remainders assigned to the margin and multiple change fields. Because of rounding, the numbers may not add up to the TSR figure shown. Share change refers to the change in the number of shares outstanding, not to the change in share price. Net debt change refers to the change in market cap relative to the change in enterprise value and includes the change in debt and cash.
Disclaimer: The materials contained in this report are designed for information purposes only. BCG does not provide fairness opinions or valuations of market transactions, and these materials should not be relied on or construed as such. A company’s inclusion in the ranking does not represent an endorsement by BCG. This report does not provide investment or financial advice. Users should contact their advisor to receive such advice. BCG has used publicly available data. BCG has not independently verified the data and assumptions used in these analyses. BCG has made no undertaking to update these materials after the date they were gathered for publication, after which such information may become outdated or inaccurate. Changes in the underlying data or operating assumptions will have an impact on the analyses and conclusions. The underlying model used for this study is designed to work across industries and is no replacement for a detailed calculation that accommodates company- or industry-specific adjustments, which may have an impact on the accuracy of the results.
The top performers delivered an average five-year TSR of 18.4%, almost four times the market average. The biggest driver of TSR for these top performers was revenue growth, accounting for 13.4 percentage points. These companies also leveraged their cash flow contribution (CFC) to further increase value creation. Furthermore, the change in valuation multiple had little impact on their performance, in contrast with bottom performers, which were not able to retain their valuation multiple.
Our analysis indicates that companies can create value regardless of their industry sector and scale. At least one company from most sectors had returns exceeding the market average. The financial institutions and insurers sector had an outstanding average five-year TSR of 11.3% followed by transportation and infrastructure with 8.5%. Additionally, companies of all sizes were present in the top quartile, suggesting that players of any scale have the potential to unlock value.
We identified common strategies in the top performers that helped them create value and navigate a challenging market. Top performers boosted both the top and bottom line while returning cash to shareholders—and without necessarily elevating their debt levels. They did so through an effective M&A agenda, higher participation in foreign markets, increased dividend distributions, and effective two-way communication with investors.
The Mexican Market Landscape: Challenges and Prospects
Mexico’s macroeconomic landscape has been one of opportunities—and obstacles—for listed companies. The country’s GDP increased at a CAGR of 1.3% over the past ten years, which is in line with the Latin American average of 1.2%. In the capital markets, the market cap of listed companies grew at a 2.6% CAGR to reach approximately US$460 billion, with the number of listed companies increasing from 136 in 2012 to 139 in 2022.
Over the past year, nearshoring has become attractive for foreign companies, offering Mexico an opportunity to boost manufacturing and exports. Conservative fiscal and monetary policies as well as a projected surge in domestic middle-class consumption (driven by demographic expansion) suggest an optimistic economic outlook. Yet Mexican capital markets still need to fully capture these benefits.
Recent trends are challenging the development of Mexican markets. The COVID-19 pandemic made it difficult for companies to grow top-line and maintain profitability. High interest rates and inflation remain potential obstacles to private-consumption growth. Moreover, the upcoming elections in June 2024 have added uncertainty to Mexico’s situation.
In the context of this landscape, we identified the value creators and analyzed how their industry sectors, scale and size, and trading volume factor into their performance. We also pinpointed common strategies shared by the value creators. In addition, we evaluated whether Mexico’s equities market is suitable for value creation and how companies can navigate challenges and deliver returns to shareholders.
Understanding the Drivers of TSR
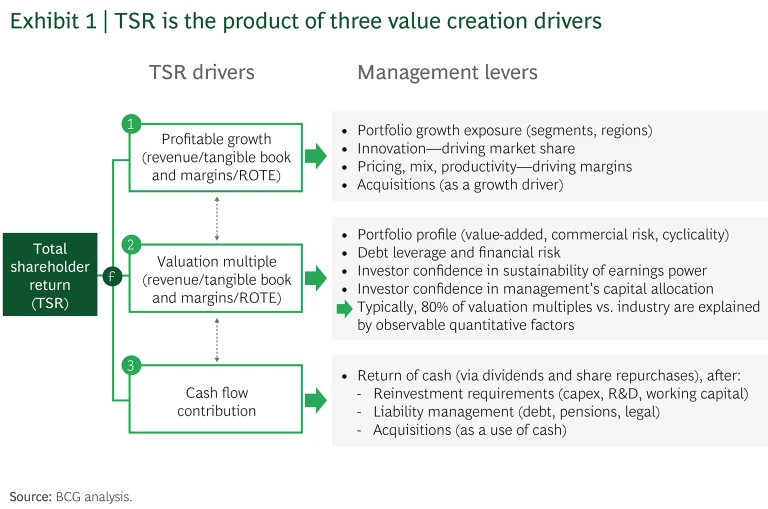
Total shareholder return (TSR) measures a combination of share price appreciation and dividend yield for a company’s stock over a given period of time. It serves as a comprehensive metric for gauging a company’s shareholder value creation performance.
TSR can be broken down into its four contributing components:
- Revenue/tangible book growth—top-line growth.
- Change in margins/return on total equity—change in net profit margin.
- Change in valuation multiple—change in historical multiple such as price-to-earnings ratio or EV-to-EBITDA.
- Cash flow contribution—free cash flow to equity holders, measured as cash payouts (dividends, buybacks), capital allocations (capex, working capital), and leverage for non FI&I (debt, cash).
BCG’s TSR model uses revenue increases and changes in margins to measure profit growth. It then uses the change in valuation multiple to evaluate the impact of investor expectations on TSR. Together, these two factors determine the change in a company’s market cap and the capital gain or loss to investors. Finally, the model tracks the distribution of free cash flow to investors and debt holders in the form of dividends. TSR disaggregation and key levers are summarized in Exhibit 1.
The Mexican Market’s TSR Performance
To understand Mexico’s performance, we focused our analysis on Mexican listed companies with a market cap above US$1 billion at the end of 2022, which totaled 52 companies in seven sectors (see the
appendix
):
- Financial institutions and insurers (FI&I)
- Transportation and infrastructure (T&I)
- Consumer packaged goods (CPG)
- Industrial goods (IG)
- Retail
- Conglomerates
- Technology , media and entertainment, and telecommunications (TMT)
We analyzed these companies over a five-year period ending in December 2022 to capture their end-of-year results and full-year strategies.
Mexico had a five-year TSR of 5.2%, while CETES (364 days) had a five-year TSR
Improving TSR in Mexico
From June 2018 to June 2023, Mexico delivered a five-year TSR of 6.7%, 1.5 pp higher than the 2017 to 2022 five-year TSR of 5.2%. Nevertheless, the country still lags CETES, which had a TSR of 7.2% over the 2018 to 2023 period, and the S&P 500, which increased by 2.9 pp during the same timeframe to a TSR of 12.3%. It is important to highlight that these figures don’t include the impact of the Mexican government’s October 2023 action on airport concession tariffs.
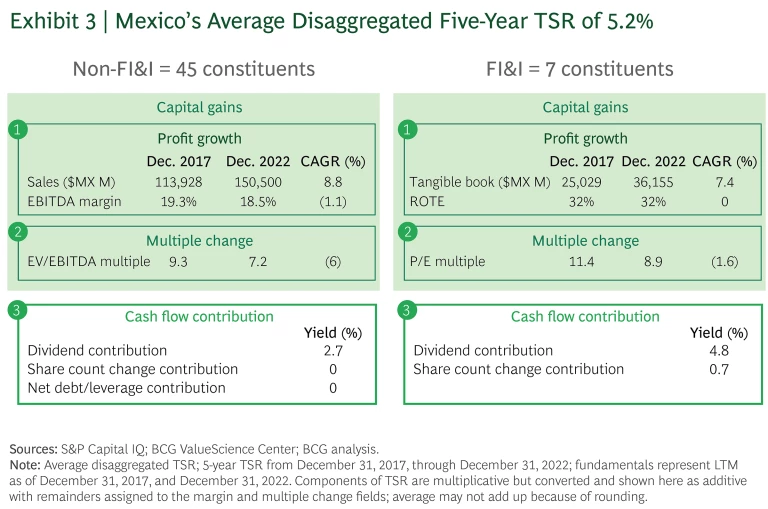
We used BCG’s TSR disaggregation model to understand the drivers of market performance for Mexico.
Mexico’s five-year TSR was driven mainly by revenue growth (8.6 pp), followed by CFC (2.9 pp). Conversely, the change in margin (–1.1 pp) and valuation multiple
Which Companies Were the Top Performers and How Did They Create Value?
Some companies in the Mexican market were able to deliver higher returns and create value for shareholders despite the overall market conditions. The top-quartile value creators had an 18.4% five-year TSR, almost four times greater than the market average of 5.2%. (See Exhibit 4.)
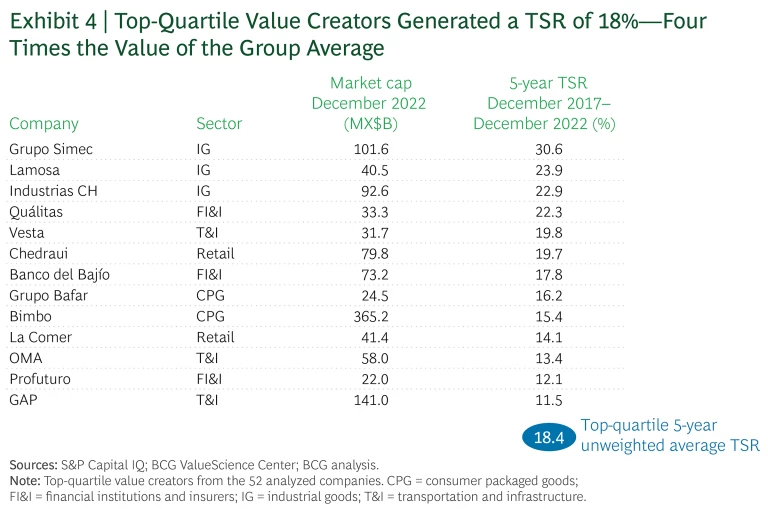
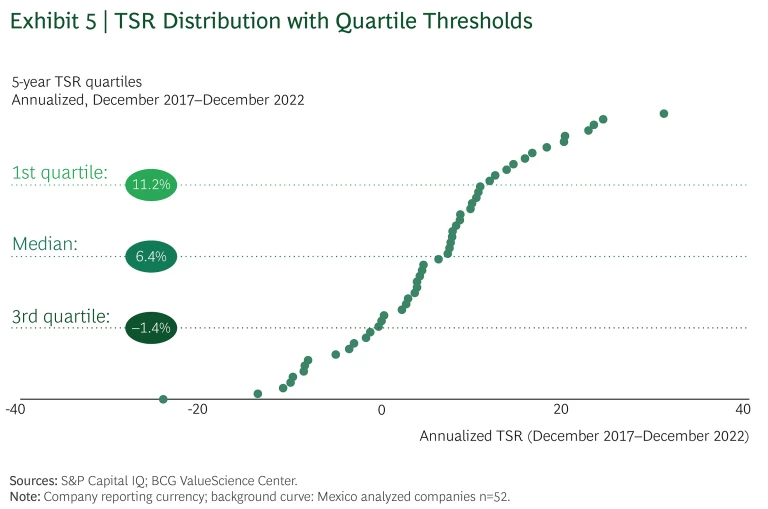
There was a large dispersion between the top and bottom performers. As shown in Exhibit 5, the threshold for being in the top quartile was 11.2%, compared with the median of 6.4% and the third-quartile threshold of –1.4%.
What Sets the Top Performers Apart?
To understand what distinguishes the top-quartile value creators from the rest of the pack, we compared them with the overall market and bottom quartile. TSR for top-quartile performers surpassed the market by 13.2 pp and the bottom quartile by 27.0 pp. (See Exhibit 6.)
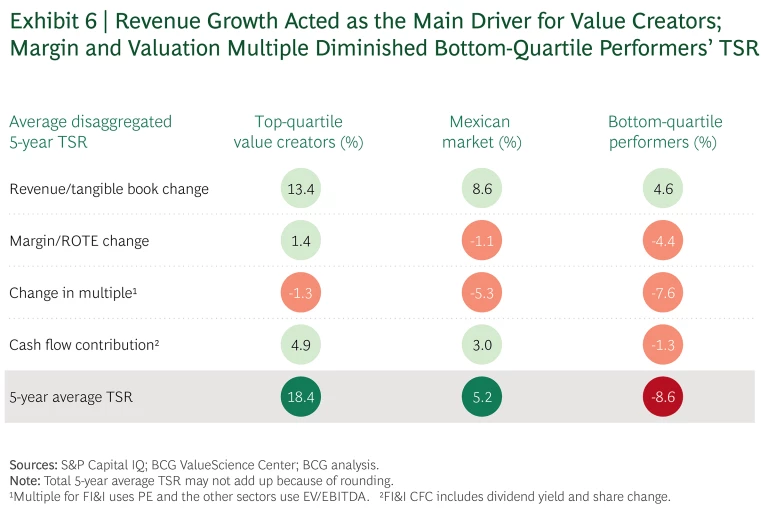
The main difference between the drivers of the top and bottom quartiles was the change in revenues, with an 8.8-pp gap between the two groups. The other drivers (margin, valuation multiple, and CFC) all had a difference of about 6 pp.
Top-quartile performers demonstrated that not only were they able to increase their revenue, but they were able to do so profitably. Moreover, they managed to grow while maintaining debt levels, with a higher CFC than the market and bottom-quartile performers. In contrast, the overall market showed a decrease in margins, which was accentuated in the bottom-quartile performers. It is worth noting that the valuation multiple did not have a considerable impact on the top-quartile performers, showing that their performance is priced in by market analysts.
Companies of All Types and Sizes Can Reach the Top Quartile
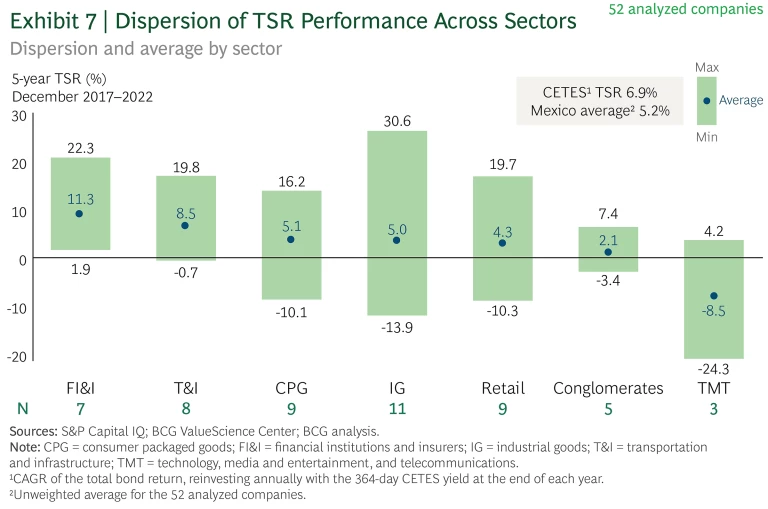
To better understand top performers, we analyzed them at the sector and scale level. The analysis shows that dispersion of TSR within sectors was 6.6 pp larger than dispersion between sector averages, suggesting that companies from any sector have the potential to unlock value regardless of market conditions. (The TSR dispersion within sectors was 26.4 pp on average, and the dispersion of sector TSR averages was 19.8 pp.)
FI&I emerged as the leading sector, achieving a 11.3% five-year TSR, followed by T&I with 8.5%. TMT was the lowest-performing sector with a five-year TSR of –8.5%. (See Exhibit 7.) IG showed the highest TSR dispersion within the industry: its top performer achieved a 30.6% TSR while the worst performer had a –13.9% TSR. This further shows that companies can create or destroy value within the same sector.
Although most sectors were negatively affected by the change in valuation multiple, some were able to mitigate the effect through CFCs. (See Exhibit 8.) Moreover, these sectors managed to do so while still boosting the top line. TMT and retail were the sectors most affected by the change in multiple, but sectors like FI&I and T&I achieved outstanding TSRs by increasing the top line and returning cash to shareholders.
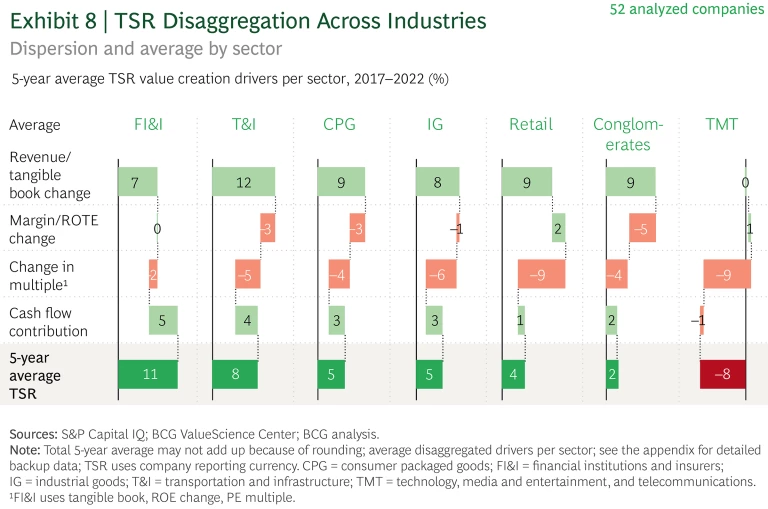
The negative effect of the valuation multiple can be explained by the presence of mature companies with limited expectations of growth, a handful of success stories in the market, and a drastic change in business model impacting top-line growth and profitability margins. This last observation was particularly evident in TMT, which showed the lowest valuation multiple of 5.3.
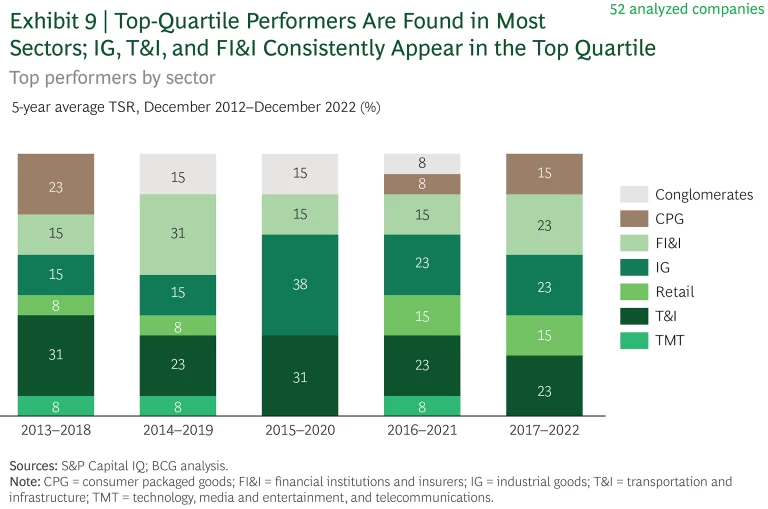
IG, FI&I, retail, CPG, and T&I all had at least one top-quartile performer. IG and FI&I were the most represented sectors, with three companies each, and consistently appeared in the top quartile over the past five years. (See Exhibit 9.) Additionally, IG, FI&I, TMT, conglomerates, and CPG had companies among the bottom performers.
In terms of market cap, companies of all sizes were present in the top quartile. Companies were divided into three categories: small cap (less than US$3.5 billion), mid cap (US$3.5 billion to US$8 billion), and large cap (more than US$8 billion). Mid-cap companies were overrepresented with 39%, while large-cap companies were underrepresented with 8% in the top quartile. Mid-cap companies had an average five-year TSR of 8.4%, while small-cap and large-cap companies delivered five-year TSRs of 3.7% and 5.4%, respectively. On the same note, companies were able to create value regardless of trading volume and regardless of whether they were listed as American depositary receipts (ADRs) in the US.
Putting TSR into Action: How Companies Can Unlock Value
Mexico’s top value creators have demonstrated that it is possible to grow despite the challenges the market faces. Our analysis of these companies’ strategic agendas shows that there are certain common strategies that drive these players to create value for shareholders.
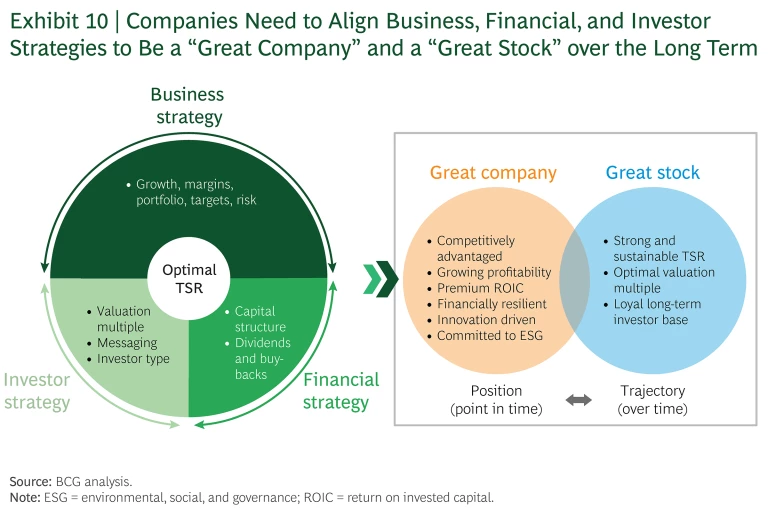
We analyzed their strategy through BCG’s TSR optimization framework, which confirmed that being a “great company” with a competitive advantage and growing profitability is not enough to provide value to shareholders. Companies must also be “great stocks,” meaning they have an optimal valuation multiple, strong and sustainable TSR, and loyal long-term investor base. By aligning their business, financial, and investor strategies, companies can offer investors a compelling investment thesis. (See Exhibit 10.)
Business Strategy
An effective great-company business strategy involves identifying sources of competitive advantage and fostering growth through programs that drive performance under both normal and challenging situations. We can see this growth driver in the top-quartile performance from 2019 to 2022. Despite the COVID-19 pandemic, most top performers increased revenues and margins. During the 2019 to 2022 period, 92% of the top-quartile performers boosted revenues and 61% lifted margins.
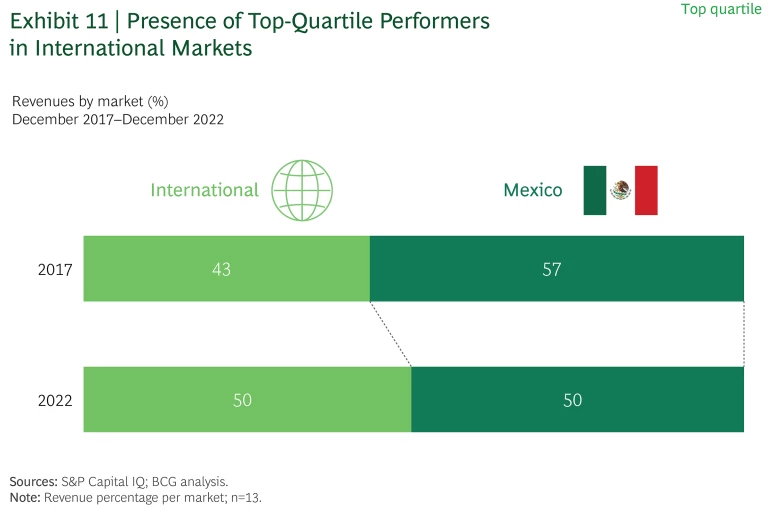
Most top performers demonstrated that expanding their geographic portfolio was also advantageous. The revenues of the companies already present in international markets increased during the past five years. (See Exhibit 11.) For example, Grupo Simec’s 40% CAGR in Brazilian revenues from 2017 to 2022 exemplifies the company’s skill in seizing market opportunities and driving growth. Another example is Grupo Bimbo, which expanded its reach through acquisitions in more than 30 countries, solidifying its presence in key markets like Spain and Brazil.
When we looked at inorganic growth in the top quartile, we observed that the companies with M&A activity had accretive results. For instance, Chedraui expanded its US presence by acquiring Fiesta Mart in 2018. Then, in 2021, the company added warehouse grocery stores in California, Nevada, and Arizona through its purchase of Smart & Final and gained discount stores in Mexico’s Huastec region through its acquisition of Arteli. Chedraui grew both top-line and bottom-line during this period, showcasing its ability to complete these deals while delivering accretive results and maintaining healthy debt levels.
Financial Strategy
To have an effective financial strategy, companies must be disciplined on dividend distributions and share buybacks. We observed consistency in terms of dividend contributions across the board, including top-quartile companies, which managed to distribute dividends while growing the top line. (See Exhibit 12.) Moreover, the top-quartile companies demonstrated that they could grow in revenues—at an average CAGR of 13%—without necessarily increasing their debt levels and having a high dividend yield, which allowed them to deliver even more value to shareholders.
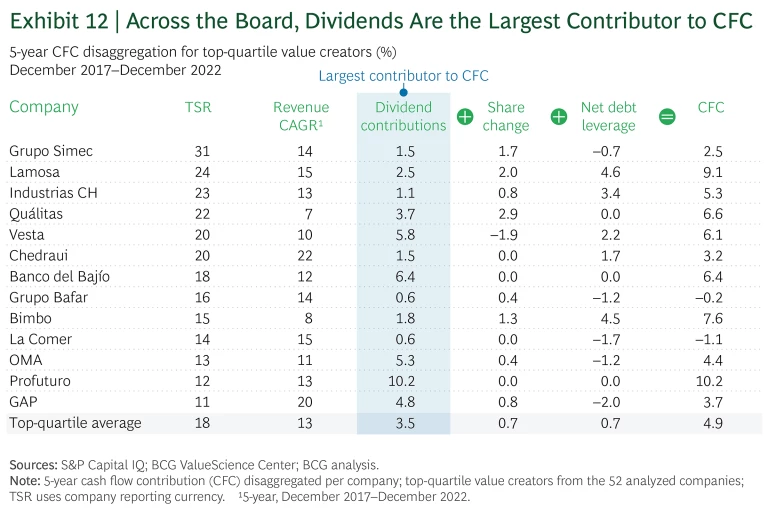
For example, Lamosa has had a steady generation of positive free cash flow (FCF) and an adequate liquidity position. Through a disciplined debt repayment program, the company has maintained consistently low leverage levels. And Lamosa’s strong operating cash flow generation has allowed it to cover working-capital requirements, capex, and dividend payments, resulting in positive FCF generation.
Investor Strategy
To retain their valuation multiple and attract investors, companies must look through an investor lens. They need to identify their investor base and mold their message to fit them, implementing a transparent line of communication through which they notify investors about milestone accomplishments and regularly report metrics.
This can be seen in the contrasting effect of the multiple on the top and bottom quartiles. The valuation multiple had a less negative impact (1.3 pp) on top-quartile performers, compared with bottom-quartile performers (7.6 pp). By implementing a strong investor communication strategy, companies can retain their valuation multiple and deliver value to investors.
A clear example of effective investor communication is Walmart de México y Centroamérica (Walmex). The company has focused on prioritizing transparency, providing regular updates, and maintaining a strong financial performance. Feedback from the market is valued, creating a two-way communication channel. Walmex has effectively used annual analyst meetings, regular conferences, roadshows, and the Walmex Day event to maintain consistent communication and transparency. Furthermore, the company offers stock options to its executives, incentivizing them to use an investor lens when making decisions. Walmex’s focus on results and long-term implications remains pivotal, helping the company to achieve its multiple objective (an EV/EBITDA multiple that has grown from 14 in 2017 to 16 in 2022).
A Guide to Achieving a Winning TSR
CEOs, CFOs, and boards of directors can leverage our six-part guide to create a path to a winning TSR and become both a great company and a great stock. (See Exhibit 13 and the appendix .)
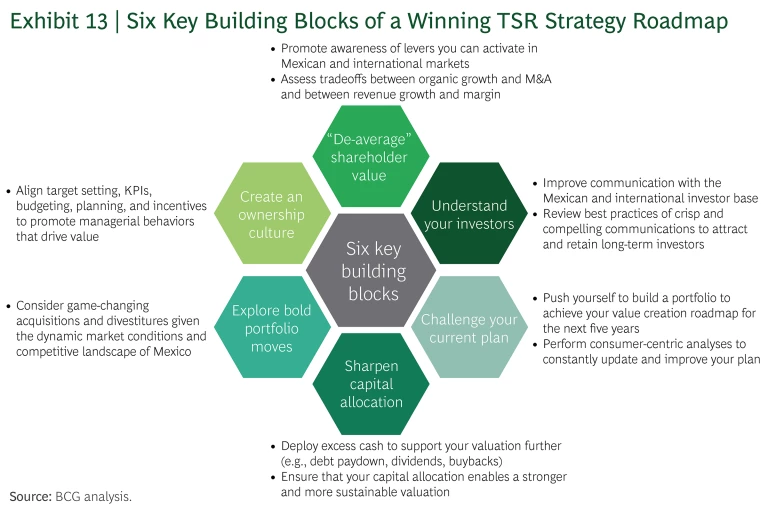
As our analysis of the Mexican market shows, investors in the country have an opportunity to generate value by targeting top-performing Mexican companies. These leading performers have shown that it is possible to deliver value to shareholders in the Mexican market with returns that were almost four times higher than the overall market. Other companies can also aspire to become a great company and great stock by aligning their business, financial, and investor strategies—and thus attracting investors and ensuring long-term growth.
There’s an opportunity for the Mexican market to grow and overcome its macroeconomic challenges. In the meantime, companies can create value for shareholders while contributing to the development of capital markets.
Acknowledgments
The authors thank Alfredo Urquiza and Jeronimo Fueyo for their contributions to this report.


