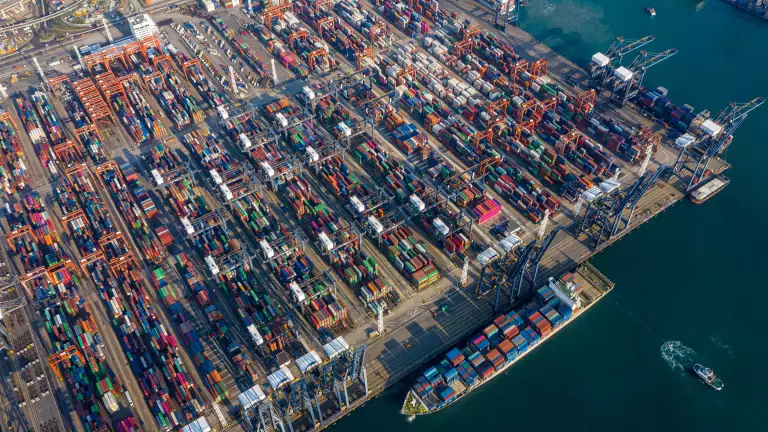
A half-decade of disruption that has included trade wars, the pandemic, natural disasters, severe supply bottlenecks, Brexit, the war in Ukraine, and increasingly assertive industrial policies is profoundly redrawing the map of global manufacturing for export.
New BCG research underscores the magnitude of the resulting shifts. More than 90% of North American manufacturing executives we surveyed said that they have moved some of their production and sourcing to different countries over the past five years—and will continue to do so during the next five years.
Our research—which included an extensive survey, an analysis of trade patterns and factors that define global manufacturing competitiveness, and interviews with executives—identified a number of recent changes in manufacturing and sourcing footprints:
- Geopolitical uncertainties and high US tariffs are driving a significant shift away from China as the primary export platform for the US market in a wide range of industrial sectors.
- Mexico, Southeast Asia, and India are quickly emerging as future export manufacturing powerhouses. All three offer competitive cost structures, deep pools of labor, and growing scale and capabilities across diverse industries. India has the additional benefit of possessing a potentially enormous domestic market.
- Morocco, Turkey, and other countries are in strong positions to expand their export manufacturing, powered by competitive costs, ample labor, and proximity to the EU and other markets—especially for companies that get in early.
All of these shifts are occurring at a time when US domestic manufacturing is ramping up in response to policy support and rising demand.
The primary driver of these shifts is the ongoing quest for low costs. But respondents to our survey also indicated a strong desire to shorten lead times, operate in more stable business environments, and gain flexibility to respond to disruption—even at the cost of several points of operating margin. Notably, only 55% of North American executives in our survey said that their production moves had met their objectives.
To get better results, companies need to adopt a “market-back” approach, starting with the end market and designing a comprehensive manufacturing and sourcing footprint strategy to serve it. They should tailor the footprint to their industry and balance cost against other operating considerations. In our experience, a successful footprint transformation can improve companies’ resilience and sustainability and cut their global manufacturing and supply-chain costs by 20% to 50%. It can also help companies build competitive advantage by staying ahead of evolving global trends and capitalizing on new opportunities.
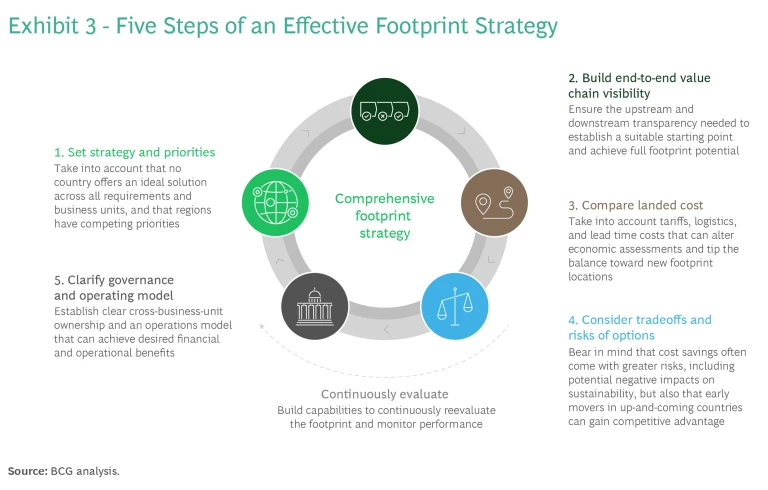
We suggest a five-step approach that involves establishing a clear strategy, building end-to-end visibility, comparing landed costs, considering the tradeoffs and risks of various location options, and clarifying governance and the operating model.
What’s Driving the Manufacturing Migration
The disruptions of the past few years have altered the global context in which manufacturers operate, forcing them to make complex tradeoffs. Wage inflation, accompanied by unusually tight labor markets, has been a major factor. But capturing the true differences in nations’ labor costs involves considering not just the wages but also the productivity of factory workers.
Wage inflation has outpaced productivity gains in most regions. Labor costs adjusted for productivity rose by 21% in the US from 2018 through 2022, for example, and by 24% in China. Similarly, productivity-adjusted labor costs rose by 22% in Mexico and by 18% in India. Nevertheless, these two countries remain among the world’s most cost-competitive sources of manufacturing, and Mexico is the most competitive near-shore option for the US.
Our research also found that manufacturers are willing to pay more to make their supply chains robust and resilient to disruption. In our survey, executives said that they would give up, on average, more than 2% of gross margins to operate with sufficient labor and shorter lead times. They also indicated a willingness to pay more for better stability, greater ease of doing business, and stronger logistics infrastructure.
How Manufacturers Are Responding to the Challenges
To get a sense of how manufacturers have been responding to the challenging global business environment, we surveyed North American companies across multiple industrial sectors. More than 90% of respondents said that they had relocated production or some of their supply base to other countries over the previous five years. Of those, half reported that they had shifted more than 20% of their manufacturing and supply chain spending. More than 90% of surveyed executives indicated that they will make similar moves over the next five years.
The redistribution of manufacturing is evident in trade data. While US goods imports from China declined by 10% from 2018 through 2022 in inflation-adjusted terms, they rose by 18% from Mexico, 44% from India, and 65% from the ten countries of the Association of Southeast Asian Nations (ASEAN). (See Exhibit 1.)
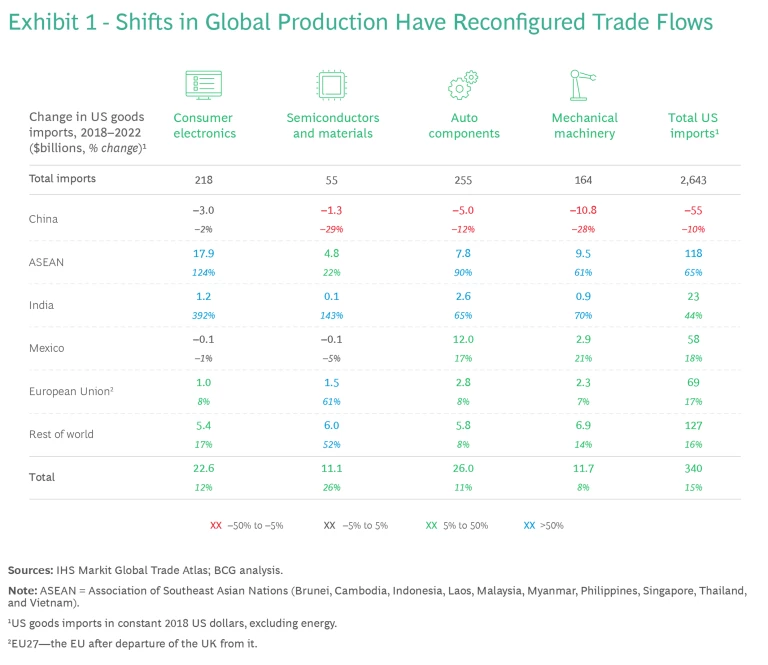
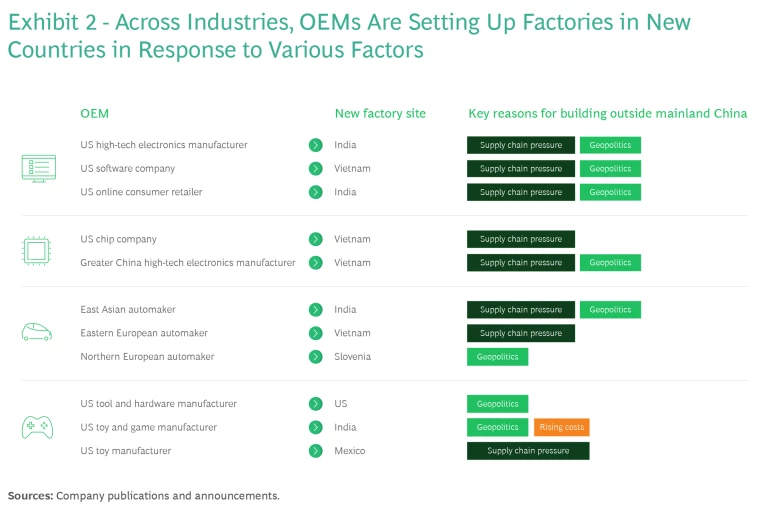
For example, US imports of mechanical machinery from China shrank by 28% from 2018 through 2022, but increased by 21% from Mexico, 61% from ASEAN, and 70% from India (albeit from a low base). US imports from China did increase slightly in a few sectors, however, such as biopharmaceutical products and chemicals. The main drivers of these shifts were supply-chain and geopolitical pressures. (See Exhibit 2.)
The outcome of these production shifts has been mixed. As noted earlier, just over half of North American executives said that their moves met their objectives in terms of improving unit costs, shortening lead times, or achieving sustainability goals. The specific reasons for falling short differed by country. But our analysis suggests that the disappointing results were generally due either to one-off or incremental decision making or to inadequate consideration of non-cost factors that add complexity and increase the need to carry costly inventory. These factors include business environment, labor availability, and quality of logistics infrastructure.
Designing an Optimal Global Footprint
Building a manufacturing and sourcing footprint that offers sustained competitive advantage requires a comprehensive approach with five key actions. (See Exhibit 3.)
Set a Strategy and Identify Priorities
The first step in undertaking a footprint transformation is to consider the company’s starting point and the challenges that leadership needs to solve. This inquiry should lead to identifying a set of priorities to support the company’s overall business model and strategy. No country offers an ideal solution that meets all requirements, so any adjustment in footprint will entail making complex tradeoffs. In the absence of an explicit strategy that spans business units and regions, attempts to pursue priorities that are not entirely compatible—such as shortening lead times, reducing reliance on tough labor markets, and lowering production costs—are likely to yield a suboptimal, patchwork footprint. Basing location decisions on consistent priorities will allow a company to build a coherent footprint that supports the overall business model and strategy.
Build End-to-End Value Chain Visibility
The next step is to gain a full view of the entire value chain, including the sources of materials in an assembled product. Company leaders should understand who the suppliers are, where they’re located, and what “pinch points”—potential supply disruptions that could drive up cost and cut off access to critical inputs—threaten manufacturing operations. For example, it is critical to know how easily the company can find alternative suppliers on short notice. Furthermore, building visibility into emissions throughout the value chain is now required by law in some regions. The EU, for example, mandates that companies must document all Scope 3 emissions associated with many imported goods.
Compare Landed Costs
We have updated the BCG Global Manufacturing Cost Competitiveness Index, which benchmarks costs in 38 leading export manufacturing nations against those of the US, to reflect the cost of manufacturing a product and bringing it from the factory to its end market. (See Exhibit 4.) In addition to accounting for productivity-adjusted labor costs and energy prices, we have included transportation costs to the US, machinery depreciation, and tariffs. For goods imported into the US from China, the cost-competitiveness index also factors in the costs of trade-war tariffs imposed by the US on Chinese-made products.
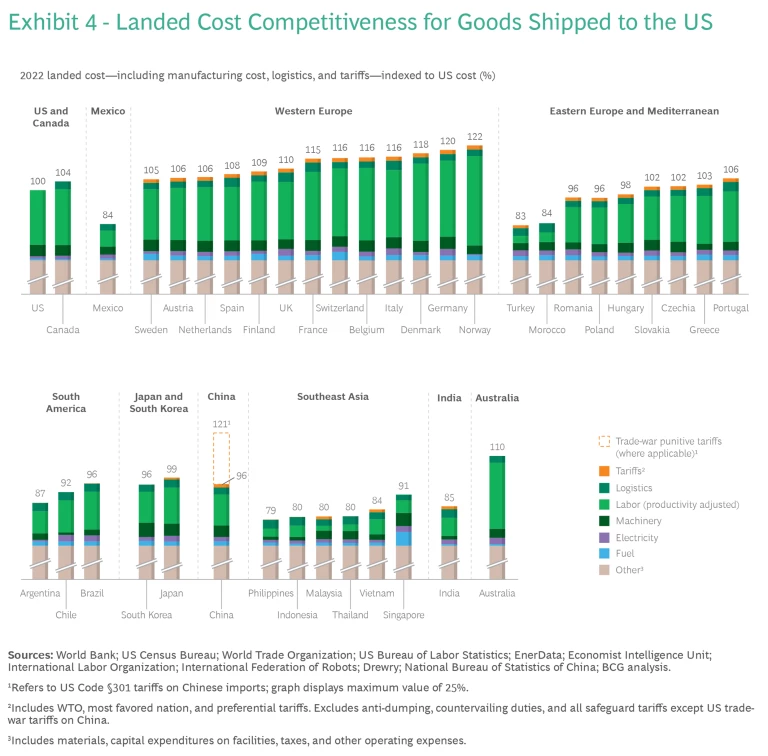
The most competitive near-shore options for manufacturers differ by region. For Western European manufacturers, Turkey and Morocco are among the lowest-cost options; for the North American market, Mexico may be optimal.
Despite its rising labor costs, China remains cost effective relative to most of its major global competitors. But this does not hold true for goods exported to US in industries affected by penalty tariffs. Without those tariffs in place, China has a slight 4% landed cost advantage over US locations for goods consumed in the US. With those tariffs in place, China is roughly 21% more expensive than the US.
Because precise cost structures vary by industry, by region, and often by locality within a country, companies must conduct on-the-ground analysis. To realize labor productivity advantages in certain regions, manufacturers may also need to design new processes and train workers in new locations. Still, the index offers a useful macroeconomic view of cost competitiveness and changes over time.
Consider the Tradeoffs and Risks of a Broad Set of Options
When assessing new locations for diversifying a production footprint, companies need to gauge their capacity to deliver. Does the country have a well-established and sufficiently large manufacturing and supply base that can reliably absorb anticipated production volumes, and do its workers have the skills that the company requires? Even in countries with established industries, manufacturers may need to invest in skills training and revise their processes to achieve the desired productivity.
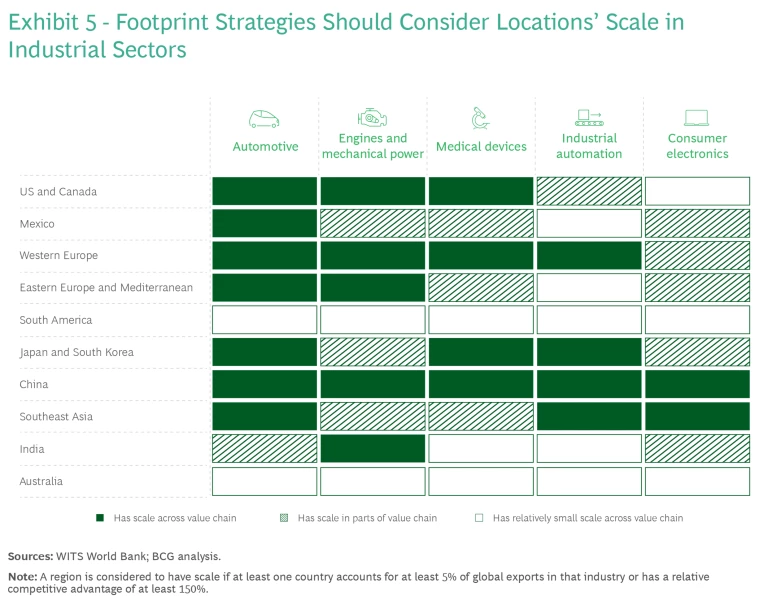
In some industries, relatively few cost-competitive assembly and supply options may be available. Manufacturers should assess the value chain holistically and consider up-and-coming countries or regions that are starting to build scale and capabilities in their industries. For instance, India is rapidly developing as a producer of engines and turbines, Morocco is rising fast as a destination for automotive assembly and components, and Vietnam is becoming a center for consumer electronics. First movers in such countries often gain the opportunity to establish capacity while labor, land, and other factors are abundant and very affordable.
Often, the competitiveness picture becomes vastly more complicated when analysts introduce non-economic factors that affect operations into the equation. In many cases, the inefficiencies and risks associated with a poor business environment, political instability, insufficient transportation infrastructure, and unfavorable government investment policies can offset cost and time-to-market advantages. A location’s performance on sustainability metrics is likely to become an increasingly important factor in the manufacturing and sourcing calculus.
Clarify Governance and the Operating Model
A company can easily lose the financial and operational benefits of a sourcing and manufacturing footprint strategy unless it establishes clear ownership across business units and incentives for success. Creating a governance structure that enables the leadership team to maintain a holistic view of the organization’s manufacturing and sourcing operations and to make decisions over locations is key to long-term success. In addition to these five steps, leadership must periodically review the company’s global manufacturing network and continuously assess its performance as policies, the global context, and risks change.
Comparing Countries’ Competitive Advantages
When companies take all five recommended actions into account, no country emerges as the best option for landed cost and time to market and operating environment. Nor does every target country have sufficient production scale in the desired industry. (See Exhibit 5.)
Instead, each country has its own advantages and disadvantages. (See Exhibit 6.) Consequently, when designing their production footprints, manufacturers must make tradeoffs that best serve their strategic priorities.
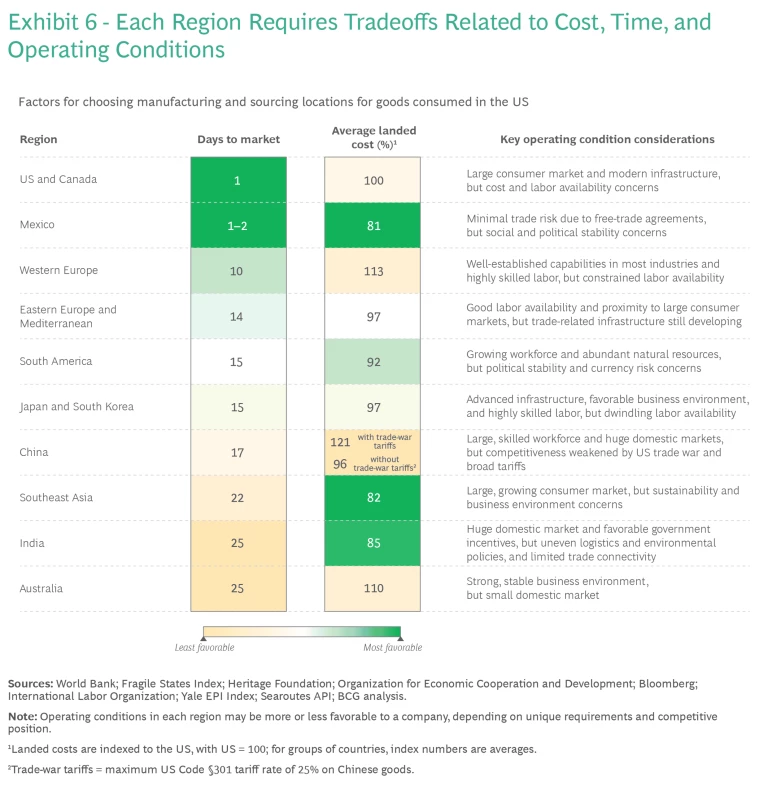
The US, Canada, and Western Europe, for example, offer reduced risk, shorter time to market, and strong operating conditions for companies that wish to regionalize their supply chains. The increasing prevalence of industry policy support in these countries—in such forms as the US’s Inflation Reduction Act—will further improve their cost competitiveness. But policy intervention may not fully offset the generally high costs in these countries, and labor availability is uncertain. It is also important to zoom in on specific regions within each country. Within the US, for example, wage rates, labor availability, and access to logistics infrastructure can differ significantly in the Southeast and the Midwest. Mexico is a cost-competitive near-shoring location for the US market, but other key operating conditions are poor in some parts of the country. Even so, Mexico has built considerable scale, capabilities, and domestic supplier networks in export sectors such as cars and parts, home appliances, and computers that should position it well in the years ahead.
Despite its rising labor costs, China remains competitive, thanks to its current workforce availability, extensive supplier base, logistics infrastructure, and key role in certain industrial value chains. Southeast Asia is highly cost competitive, but it is far from North America and Europe, labor availability can be challenging, and sustainability is a concern. India’s logistics infrastructure is unevenly developed, its environmental sustainability can be weak, and it has fewer free-trade agreements with nations other than the members of ASEAN. India is very cost competitive, however, and it has recently negotiated trade deals with Australia and the United Arab Emirates. Although India is just starting to emerge as a major exporter, it has a broad manufacturing base that supplies everything from electric vehicles and heavy machinery to chemicals and appliances for its domestic market.
Comparing Industries’ Options
The optimal footprint for a company varies by industry and must support the company’s unique starting point, products, and strategy. In each industry, companies can choose from among multiple countries with capacity and capabilities that offer cost savings throughout the value chain. There are also opportunities to regionalize the supply chain and improve time to market.
A given country’s attractiveness will depend in part on its role in a particular product’s value chain. Some nations may be viable for final assembly but lack a competitive base of system and component suppliers. Others may be strong in key components but not in final assembly.
In industry segments in which each stage of the value chain has many viable alternatives, companies can find opportunities to cut lead times or landed costs tremendously. Consider an engine or turbine that is currently assembled in the US for a US customer but contains raw materials, components, and systems that are produced in China. The benefits of keeping final assembly in the US include a strong business environment and substantial production capacity that is already in place and would be expensive to replicate elsewhere. But US assembly costs are moderately high, and labor constraints are a constant worry. China, meanwhile, has an established, efficient domestic supply base and strong assembly capabilities, but its lead times are long.
One option, which combines a quick lead time with improved resilience, would be to shift final assembly and systems to Mexico and components to Germany. These alterations could enable the manufacturer to deliver the engine or turbine 40% faster at a similar cost. Moving the value chain for engines or turbines sold in the US out of China would also reduce risks associated with US-China geopolitical competition. Capital investment would likely be needed in both countries, however, and shifting operations to Germany might raise issues related to labor cost and accessibility constraints.
A second option, which focuses on lowering costs, would be to shift assembly and procurement to India. The time to market would be slower here than in the Mexico-Germany option or in the status quo, but the potential cost savings range from 25% to 40%. Further tradeoffs would include longer lead times, the need for significant investment in new production capacity, and the need to develop a supply base in India.
For industry segments in which scale and capabilities are heavily concentrated in a handful of cost-competitive countries, there are few alternatives. Computers and other high-end consumer electronics are good examples of such segments. Production capacity is heavily concentrated in Asia, labor costs are moderately important, and distance to market is less of a priority because shipping cost accounts for a relatively small share of the product’s value. Changing footprints in such sectors requires substantial time, effort, and capital.
In most instances, companies will need to act opportunistically. In the case of electric-vehicle batteries, for example, manufacturers in the US can take advantage of policy support and significant subsidies offered through the Inflation Reduction Act.
The bottom line is that manufacturers in a broad range of industries can achieve substantial—and in some cases game-changing—cost reductions, along with improved resilience and sustainability, by boldly transforming their global manufacturing and sourcing footprints. To succeed, however, companies must do more than simply regionalize. A comprehensive footprint strategy is critical to successfully building new capabilities in up-and-coming countries, establishing joint ventures with suppliers, and leveraging government incentives to reshore key activities.
Realizing the full potential of such a transformation often requires time and significant investment. The transformed footprint must also be flexible enough to adapt as contexts and capabilities evolve. As the risk of disruption in the global business landscape increases—and as competition for suppliers and skilled labor in the world’s rising manufacturing havens intensifies—companies that move first and follow a comprehensive footprint strategy will be in the best position to create sustainable competitive advantage.
