The telecommunications industry has a dual role to play in the global effort to reduce greenhouse gas emissions: to lower its own emissions and to support its customers in reducing theirs. This year’s BCG Telco Sustainability Index offers a comprehensive portrait of the progress the industry is making on both fronts.
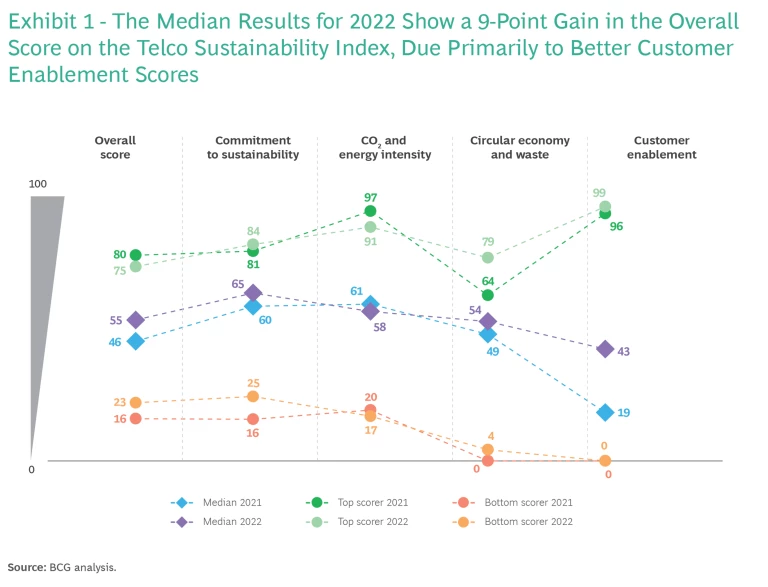
Compared with the data for 2021, the new data—collected from published reports on a wide range of environmental metrics covering operations in 2022 from 29 major telecom operators around the world—demonstrates that, overall, the industry has made progress in three of the four dimensions we track. Telcos’ commitment to sustainability and to the circular economy and waste management have shown some improvement, though individual companies have achieved mixed progress. The customer enablement dimension still lags the other three, but progress there has been impressive, which bodes well for operators’ revenues and for other companies’ efforts to decarbonize.
In the fourth dimension, which focuses on reducing CO2 emissions and energy intensity, results are somewhat poorer than last year’s, for two main reasons. First, most operators have already begun their decarbonization and energy efficiency journeys and gained quick wins in areas such as switching to 100% renewable energy, where available. These initiatives have led to significant reductions in Scope 1 and Scope 2 emissions, but they have also fed a countervailing effect. The considerable increase in demand for telecom services and data traffic across their networks is complicating operators’ efforts to reduce their carbon emissions and energy usage further.
A deeper look at the results reveals where telcos are making gains, where they need to improve, and what challenges and opportunities they face in doing so.
The Overall Picture
Data traffic over the world’s telecom networks is increasing rapidly, as is pressure from both business and retail customers for progress on key sustainability metrics. As a result, telecom operators are actively seeking ways to meet their sustainability goals, to future-proof their business against the rising costs of energy and of carbon abatement, and to reduce the risks associated with climate change.
Progress, however, has been mixed. The telecom industry’s overall median score improved by 9 points in 2022 over the previous year. (See Exhibit 1.) But scores on three of the four main dimensions of the index did not show equivalent gains. (See “How We Create the Index.”) Median scores for commitments to sustainability and for circularity and waste management improved by 5 points, while efforts to reduce emissions and emissions intensity actually worsened by 3 points. In fact, the advance in overall score is largely due to a very substantial 24-point gain in customer enablement—and despite this achievement, the industry as a whole still needs to improve in this dimension.
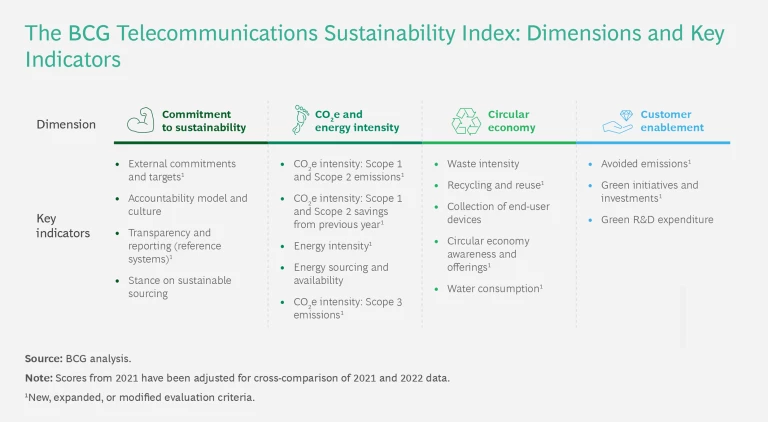
How We Create the Index
To determine a rating for each key indicator, we assess and score various qualitative and quantitative metrics specific to the indicator, including annual progress across those metrics and the company’s published commitments to sustainability. We score each key indicator on a scale from 0 to 100, and we use the results to create a weighted overall score for the whole dimension. Individual weightings vary by key indicator on the basis of the included criteria. We then calculate an overall score for the industry, with each dimension given an equal weighting of 25%.
Reporting methodologies have changed for many telcos, and this has required us to adjust some of this year’s results, for accurate comparison with the previous year’s. For example, we changed the customer enablement dimension to measure avoided emissions. Other dimensions have added new metrics, which has caused calculations for the dimensions to change slightly.
Fundamentally, the quality of the data included in the index reflects the quality of available reported data. As reporting continues to improve and move toward industry standardization, we anticipate improvements in like-for-like comparisons across key indicators, companies, and regions. Overall, although we see progress, the industry must do more to increase the breadth and improve the clarity and transparency of its sustainability reporting.
Moreover, significant gaps separate the companies with the highest scores and those with the lowest. And in some cases, the highest-scoring companies in 2021 saw their marks decline in 2022, suggesting that even industry leaders may struggle to make further gains on top of their past achievements.
Geographically, European telcos continue to lead in overall scores, yet their median overall scores decreased—a reflection of decreases across all dimensions except commitment to sustainability. Telcos that are based in Europe but that also have operations elsewhere fared a little better, thanks largely to gains in the circular economy dimension. (See Exhibit 2.)
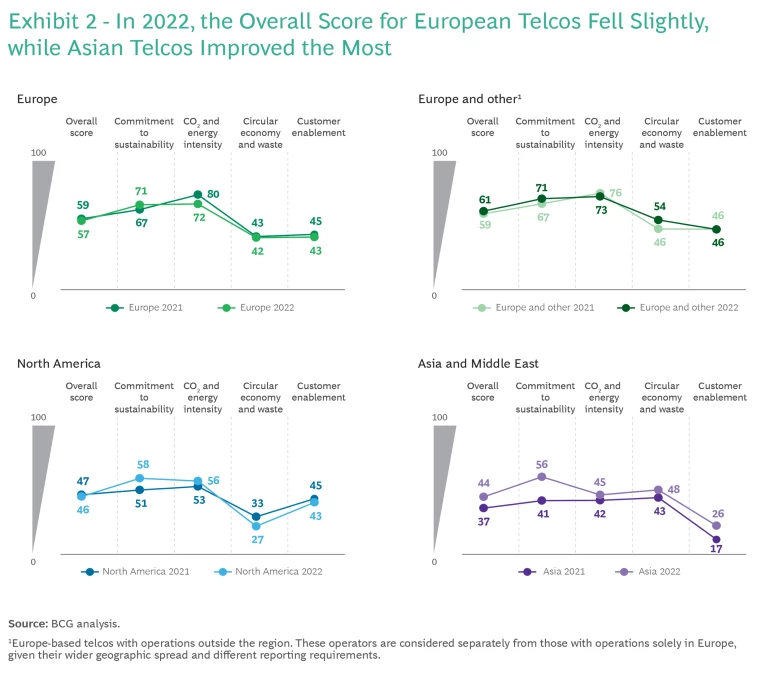
In contrast, telcos in Asia and the Middle East gained the most, rising by 7 points overall and showing improvement in all four dimensions. These results are largely the effect of differences in access to renewables, regulatory reporting requirements, and demand for sustainable products from consumers and businesses. Although this region still scores lower in all dimensions except circular economy and waste, where it outshines both Europe and North America, and it scores particularly low in customer enablement. Still, the region appears to be moving into closer accord with standard reporting practices in other regions, which could reduce the ramp-up time for companies in Asia and the Middle East as they proceed on their net zero journey.
Generally, although we observed little change in median overall scores, the results indicate that operators are continuing to enhance the frameworks and metrics they use to assess their progress in sustainability. Ironically, however, these improvements in methodology are creating new challenges, as they reveal previously unreported emissions to be accounted for, managed, and mitigated. For example, despite reducing their Scope 1 and Scope 2 emissions, telcos in Europe or based in Europe but with operations elsewhere saw their scores in the CO2 and energy intensity dimension decline—largely as a result of better reporting of, and thus an increase in, Scope 3 emissions.
Better reporting is nevertheless crucial if telcos are to understand the full extent of their environmental impact and to create tactical, action-based roadmaps to meet their commitments to sustainability. A commitment to sustainability and the ability to gain insights into progress on goals are critical to making progress on all of the other index dimensions we track.
Commitment to Sustainability
The global telecom industry has been slow to come to terms with its impact on the environment and the need to reduce its carbon footprint. That’s why the first general dimension in the index, which assesses the level of operators’ commitment to sustainability goals and the completeness and transparency of their reporting on progress, is so important. Among the most positive results of this year’s index is the relative progress telecom companies are making in advancing their commitment to sustainability. (See Exhibit 3.)
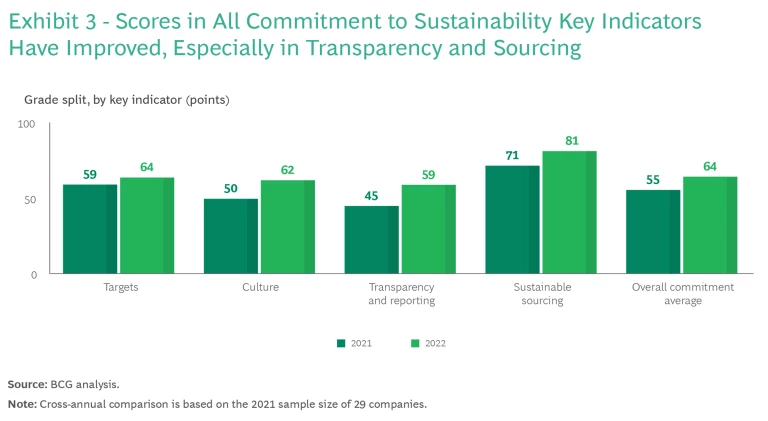
Company reports, along with scores calculated by CDP, an international not-for-profit organization that tracks corporate progress in sustainability, indicate that telecom companies improved the transparency, level of detail, and frequency of their reporting considerably in 2022, boosting their score in this area of our index by 14 points over the previous year’s mark.
That’s critical, as it implies greater accuracy and transparency in every dimension, as well as in these key indicators:
- External Commitments and Targets. Scores improved in this subcategory in part because select early targets were reached, leading to the creation of new, more aggressive targets. In addition, many operators issued targets for Scope 3 emissions and created targets for circularity and waste. Some companies also improved the actionability of their targets by sharing additional insights on how they planned to achieve them.
- Accountability Model and Culture. More telcos say they boosted their efforts to incorporate climate-related issues into their operations and culture, including by appointing leaders to focus on climate- and sustainability-specific issues.
- Stance on Sustainable Sourcing. Companies are clarifying their goals, expectations, and procurement policies for suppliers by establishing low-carbon and environmental impact requirements that apply throughout their supply chains.
Some operators also report that they have already reached their early targets in areas such as Scope 1 and Scope 2 emissions reduction, use of renewable energy, and avoided emissions through customer enablement. Although many operators still have a long way to go on their path to net zero, success in attaining these early milestones and incremental goals is critical, as it can provide valuable checkpoints to test strategies, measure progress, and inform external markets and customers of the gains the company has achieved.
Emissions and Energy Intensity
In terms of tracking the global telecom industry’s direct and indirect contributions to slowing climate change, this dimension—which covers absolute emissions of CO2e and emissions intensity across Scope 1, Scope 2, and Scope 3 categories, as well as energy sourcing and energy use—is the most important.
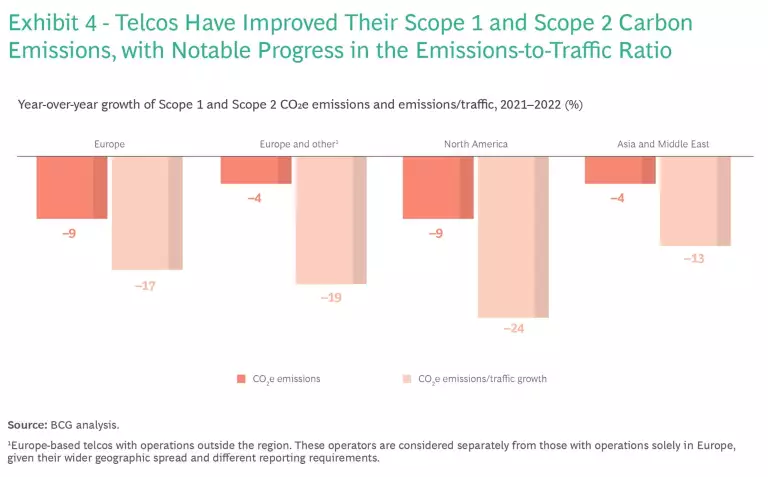
Therefore, it is encouraging that absolute Scope 1 and Scope 2 emissions within the industry declined overall in 2022. North American telcos led in year-over-year reductions, while their peers in Asia and the Middle East achieved more modest reductions. When considered in the light of their increased business activities, the result are even more encouraging: emissions intensity declined in proportion to the increase in data traffic over the past year. (See Exhibit 4.)
The decline in Scope 2 emissions is largely due to how operators sourced their energy needs. The percentage of energy obtained from renewable sources went up considerably, especially in North America, where it increased from 3% to 25%, and in Asia and the Middle East, where it rose from 5% to 17%. And while absolute energy use increased slightly, energy use as a function of data traffic decreased substantially. (See Exhibit 5.) This is largely a consequence of network improvements, including the transition away from legacy networks and the move to more energy-efficient technologies such as 5G. In addition, deploying enhanced network sensing and monitoring equipment has enabled operators to better manage their networks’ energy demand and peak consumption.
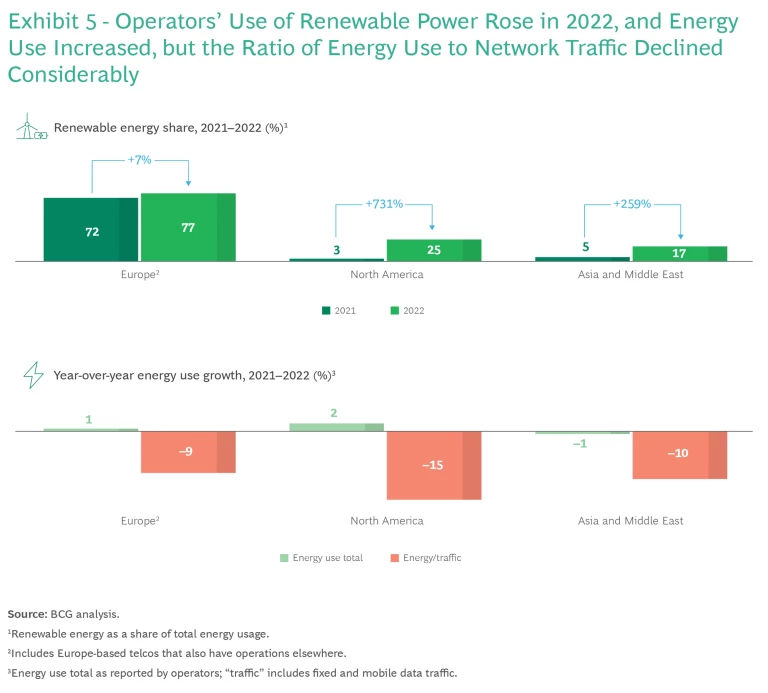
The industry’s Scope 2 emissions will likely continue to improve as more telcos gain access to renewable energy and install onsite renewable energy generation resources of their own. Managing their energy usage will remain a challenge for operators, however, as data traffic and overall demand for their service offerings grow. Although Scope 2 emissions related to energy consumption may decrease as telcos shift to renewables, operators must also seek to reduce absolute emissions as much as possible.
Moreover, as the cost of energy continues to rise, telcos must manage the financial impacts on their business. Several company financial and sustainability reports that we analyzed listed energy cost, availability, and price volatility as significant business risks, with potential impacts on overall financial performance.
Still, relative to other industry sectors, the global telecom industry is not a major direct contributor to greenhouse gas emissions. In fact, the Scope 1 emissions of the companies we analyzed this year accounted for just 4% of their total emissions, about the same as last year, while Scope 2 emissions contributed another 25%, down from 31% in 2022.
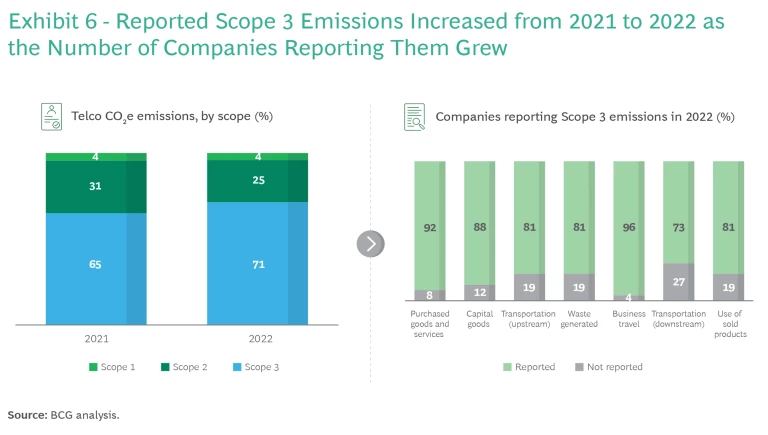
The big prize yet to be attained is reductions in Scope 3 emissions, which grew to 71% of total emissions in 2023, up from 65% in the prior year. (See Exhibit 6.) This increased percentage is likely due to improvements in the breadth and granularity of Scope 3 reporting and to the establishment of a more accurate baseline, as opposed to reflecting actual emissions increases. For instance, the sheer number of operators that report on Scope 3 emissions has been increasing over the past several years. And those that report have improved their methodology for determining relevant emissions, shifting from rough estimates to far more accurate product-based analyses across their products’ life cycle.
Thanks to better reporting, Scope 3 emissions will probably continue to increase over the next few years. But that is a small price to pay for a better understanding of the true extent of the industry’s Scope 3 footprint and for the opportunity to set more realistic standards and expectations with respect to further reductions.
The Circular Economy
The telecom industry produces waste in many forms, including mobile phones, home networking products, and various kinds of equipment and materials used in building and maintaining fixed and mobile networks. Much of that waste takes the form of e-waste, which can contain toxic but valuable metals and components. The industry’s participation in the circular economy—sourcing needed raw materials responsibly to lessen any adverse impacts on nature and biodiversity, carefully moving materials and products up the waste hierarchy, and repurposing materials to produce new products—is therefore critical.
This year’s index shows, however, that the industry needs to take a stronger and more actionable role in the circular economy, in terms of how they report on waste and how they manage it. Although more than 90% of telcos reported on their handling of waste in 2022, the extent and level of detail in their reporting has not improved significantly over the past several years.
Some companies lack transparency in detailing what they consider waste, how this waste is managed, and how much they recycle—and they omit significant waste-creating areas of operation, such as network equipment, from consideration. Only 45% of companies mention recycling network equipment, for example, and very few share specific data on such details as how the equipment is handled and what measurable impacts these efforts have had.
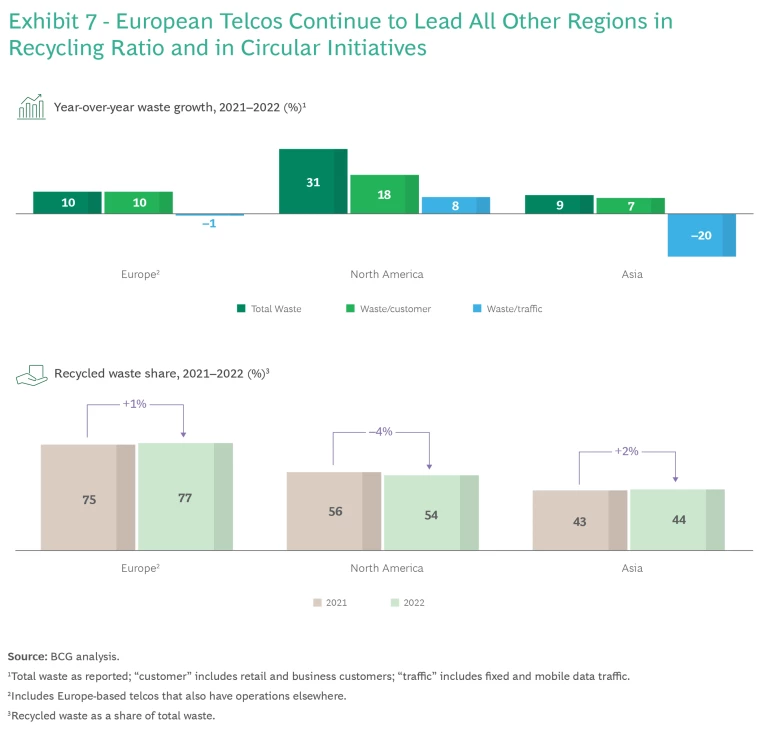
Even so, the industry’s overall score in this dimension increased by 5 points, primarily as a result of telcos becoming more aware of the circular economy and raising their customers’ awareness of it as well. Operators are also expanding device takeback programs and lessening total waste intensity, including waste-to-revenue and waste-to-customers. (See Exhibit 7.)
European telcos continue to lead with the highest recycling ratio and most active circular initiatives. This is likely the result of ongoing efforts to establish recycling and takeback programs in the region, which are only now becoming available elsewhere. European telcos are also beginning to broaden their circular ambition with targets on refurbished products.
Because the granularity of reporting requirements varies widely across regions, like-for-like comparisons for waste and circularity are difficult to make. We encourage industry leaders to redouble their efforts to standardize the variety and breadth of their metrics on waste. To do so, however, operators must shift to a mindset and culture that focuses on creating and maintaining a circular value chain for all their products.
Customer Enablement
By supporting the efforts of their retail and business customers to reduce carbon emissions, telcos can contribute meaningfully to the fight against climate change while also capturing a significant business opportunity. To do so, they must invest in building and providing products and services that help their customers make headway, and they must create the methodology needed to enable their customers to quantify their emissions avoidance.
To assess the progress that telecom operators are making on this front, we analyzed data on the telcos’ ambitions and targets for customer abatement, their methodology for quantifying customers’ emissions savings, and the reported total impact of telcos’ products and services on their customers’ sustainability. This included analyzing companies’ product portfolios, R&D expenditures on sustainable products and services, and financing of sustainability initiatives—such as onsite renewable generation or renewable energy investments—via green bonds.
The overall score in this dimension lags behind the other dimensions’ overall scores, in part because only 59% of telcos report on these metrics at all. And the data provided by many of those that do report lacks completeness and detail. Although some companies may publish a vision, they lack specific targets and clarity about what the enablement is (for example, energy savings or carbon emissions savings). Such details are essential if companies are to verify progress in this critical area.
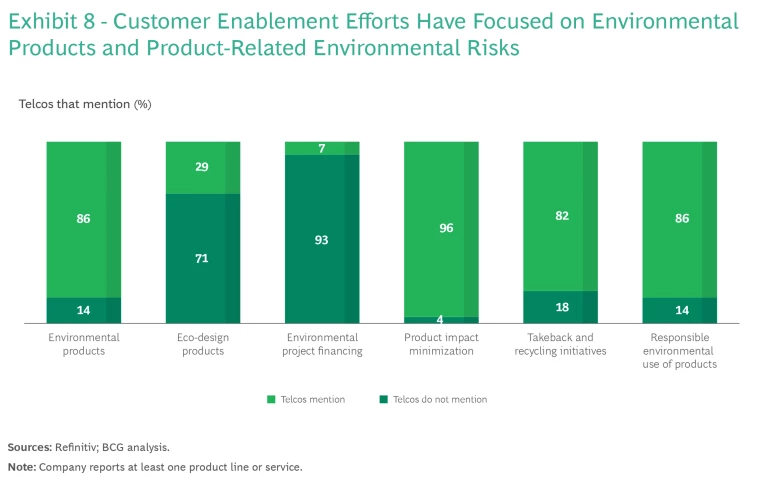
Nevertheless, this dimension saw the largest year-over-year increase of the four we track. More operators than ever before are reporting on enablement metrics and are increasing the number of environmentally relevant products and services in their portfolios. In fact, 86% of telcos included their environmental product portfolios in their reporting, and 96% mentioned efforts to minimize the environmental impact of their products. Despite these positive developments, further transparency is needed to determine the real contribution to sustainability of telcos’ products and portfolios. (See Exhibit 8.)
The results show that the industry is making progress in generating and reporting on metrics that can shed light on their efforts to help other industries decarbonize. But as with their waste reporting, operators must identify and adopt metrics that most accurately and transparently reflect their customer enablement efforts—and their customers’ resulting success in decarbonization.
The Path Forward
Although the telecom industry’s carbon footprint is small compared to that of leading emitters, this year’s Sustainability Index indicates that it continues to make gains in several key environmentally relevant areas. And given that they provide essential connectivity to people, businesses, and governments around the world, providers must double down on the industry’s critical role in enabling its customers to fight climate change.
To that end, telecom operators must accelerate their efforts in both reporting and achieving results. This will be no easy task. They must improve the accuracy and completeness of their reporting to gain a better understanding of their sustainability progress. They must continue to make gains in managing their own emissions while reducing their energy consumption and shifting to renewable energy. And they must capture a clearer picture of the carbon footprint of their upstream and downstream Scope 3 emissions.
Finally, they must boost their efforts on waste management and the circular economy and improve their reporting on these issues. This is especially important in light of the value of customer enablement. More detailed, complete, and transparent reporting will provide the foundation necessary to help customers reduce their own Scope 1 and Scope 2 emissions.
Since BCG began sharing the Telco Sustainability Index, we have seen significant improvements across all dimensions. Despite slower progress this year, the industry’s gains are a credit to the industry and show its continued commitment to sustainability.
Our goal in creating the index is to provide an illuminating level of operational detail with regard to how telecom operators function, and to understand where they lead and where they lag. Our hope is that this will help them take the actions needed to improve both the results of their sustainability efforts and the way they report on those results. Doing so is the surest path to a sustainable future for the industry and to the business opportunities that will follow.

