
In an era of global economic uncertainty and increasing protectionist sentiment, governments are relying more and more on specialized trade strategies to grow and diversify trade and secure a competitive advantage in end markets.
As the WTO struggles to conclude a new round of multilateral liberalization, governments are increasingly turning to bilateral and regional free trade agreements (FTAs) as a means of achieving their different strategies and objectives. But not all FTAs are created equal, and with the stakes so high, it is fair to ask whether the growing number of FTAs are helping private- and public-sector organizations achieve the much-vaunted benefits.
To obtain a view of the different approaches to FTAs and their impacts on competitive outcomes, Boston Consulting Group has analyzed the free trade agreements of over 100 economies and major trade blocs. Based on our research, we’ve developed the Trade Engagement Index, a tool that shows how various economies compare across several measures of trade engagement.
The index can help private- and public-sector participants alike navigate the global trade environment more effectively:
- Private Sector. Companies that have insight into the comparative strengths and weaknesses of governments’ free trade agreements can make more strategic decisions on where to invest and better understand how to reduce the overall risk of their operations—ultimately enabling those companies to optimize their global value chains and market access.
- Public Sector. Governments that understand the tradeoffs of different free-trade engagement strategies can more effectively use trade as a driving force for sustained economic prosperity. And they can use it as an avenue for achieving critical domestic and diplomatic objectives as well, including increased international cooperation, industrial strategy, and even nontrade objectives such as those related to climate-change mitigation.
Decoding the Effectiveness of Free Trade Agreements
The last comprehensive round of World Trade Organization negotiations, launched in Doha in 2001, has yet to deliver a comprehensive package of trade liberalization. More recently, the Dispute Settlement Body, which WTO leaders have called the “crown jewel” of the organization, has fallen into dysfunction since 2019 due to an impasse among members over the nomination of jurists to the Appellate Body.
In response to these challenges, governments have addressed their own needs by creating plurilateral trade agreements at a steady rate—around three per year globally—and increasingly resorting to measures such as antidumping and countervailing duties to protect perceived trade interests.
The quality of free trade agreements—and their results—can vary widely.
The growing patchwork of sub-WTO free trade agreements is evidence of countries taking control of their overall trade strategies. However, signing more FTAs does not necessarily guarantee greater economic competitiveness, as the quality of agreements and their results can vary widely. And while new “trade deals” can receive a great deal of attention, it is rare that they are examined on their relative breadth, depth, and value creation.
This has created critical blind spots for governments and multinational companies trying to read the complex landscape of risks and opportunities. Governments need to understand how effective their trade agreements have been compared to those of other countries and trade blocs; companies seeking to locate investments or source supplies want to understand how different trade strategies affect those decisions.
A New Tool for Insights into Trade Strategies
The BCG Trade Engagement Index (TEI) enables private- and public-sector stakeholders to make sense of the complex array of trade strategies by showing how individual economies compare across several measures of free-trade engagement. Building off of the Design of Trade Agreements (DESTA)
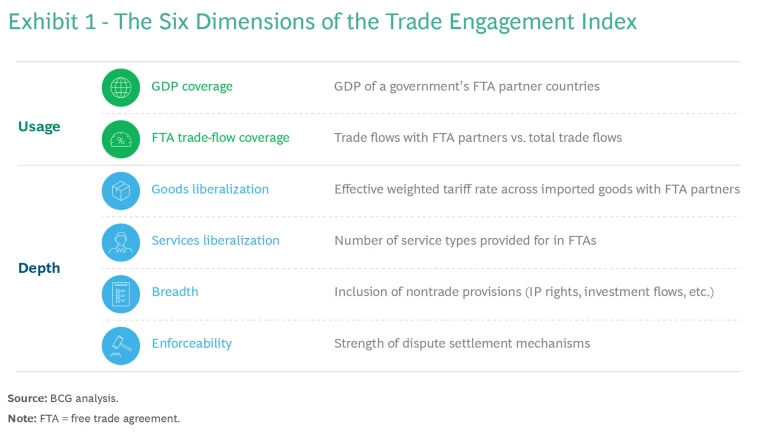
“Usage” measures the proportion of the world’s GDP that is covered by a signatory’s FTAs. “Depth” is a measure of the quality of a signatory’s FTAs, as it evaluates the degree to which the agreements liberalize the trade of goods and services (by lowering tariffs, for example) and the degree to which they address other strategic issues not directly related to trade flows (such as intellectual property rights and investment provisions) and provide for enforceability mechanisms. The TEI ranks a given economy’s FTAs from 1 to 10 across each of the six usage and depth attributes, based on available data.
The TEI can help public-sector policymakers understand whether their trade strategy is making their economy more or less competitive compared to others. It can also help identify areas to improve a government or trade bloc’s trade-engagement strategy. For business decision makers, the comparison of a particular government’s strengths and weaknesses on trade can help determine the most attractive places to locate factories or source production inputs.
Trade Engagement Strategies: A Multidimensional View
By measuring the usage and depth of free trade agreements, the TEI provides a multidimensional view of a government’s trade engagement strategy.
When various governments’ index scores are distributed across a grid measuring depth (the quality and effectiveness of trade agreements) and usage (the amount of the world’s GDP and trade flows covered by trade agreements) it is possible to characterize those governments in terms of four general international trade strategies, or archetypes. (See Exhibit 2.)
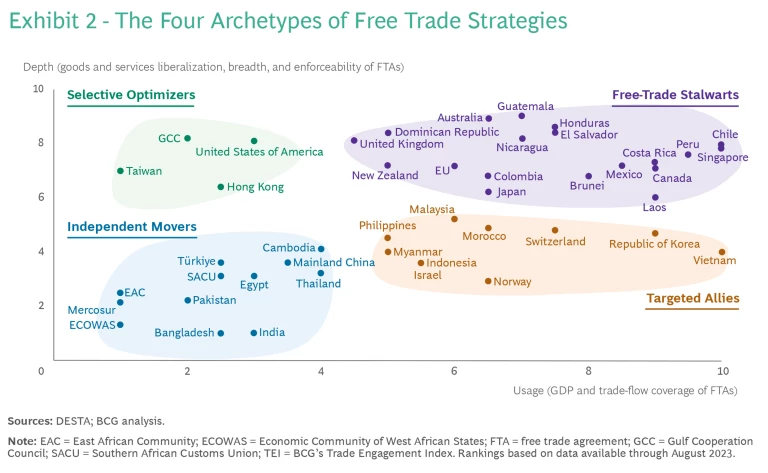
Free-Trade Stalwarts. The countries making the most deliberate use of FTAs—in terms of coverage, liberalization, enforcement, and breadth of other provisions—tend to be relatively smaller nations that rely on trade agreements to ensure access to larger markets. Countries in this group, such as the United Kingdom, Chile, Singapore, Canada, and Mexico, have broad-based coverage of the world’s GDP and their own trade flows. These countries’ coverage tends to be particularly high with their regional trading partners, for example in the Americas for Mexico, or Southeast Asia for Singapore. Within these countries’ agreements we also see a commitment to greater liberalization and enforceability. Many also leverage trade agreements to provide for measures that go beyond the trade of goods and services and help address other strategic interests (for example, intellectual property rights, investment flows, and labor practices).
Selective Optimizers. Economies in this archetype include the United States, the Gulf Cooperation Council states, and Taiwan. Each, for its own reasons, has entered into fewer free trade agreements (relative to the free-trade stalwarts). These economies tend to focus on liberalizing trade with a few key partners with whom they do a great deal of trading and have strategic ties. Similar to the free-trade stalwarts, trade agreements executed by selective optimizers generally score well across measures of depth, as the agreements tend to be very robust and enforceable. For example, with the USMCA agreement (formerly NAFTA), the US has locked in favorable terms with two proximate and vital trading partners, Canada and Mexico.
Targeted Allies. Examples include Vietnam, Korea, and Norway. These countries’ FTAs cover a sizeable proportion of the world’s GDP and of each country’s respective trade flows. However, relative to free-trade stalwarts, their trade agreements tend to demonstrate lower levels of liberalization, fewer provisions for issues not directly related to trade flows, and fewer (or less robust) enforceability mechanisms. In many cases, these countries maintain relatively higher tariffs with their free-trade partners across a limited set of targeted and strategic industries. Also, due in part to the composition of their economies and strategic priorities, these countries’ agreements tend to focus less on services and nontrade provisions. Fundamentally these countries’ agreements allow them to secure market access for key trade flows while leaving room to enact policies that protect priority industries.
Independent Movers. These countries—including mainland China, India, and Türkiye—fall at the lower end of the spectrum in both the coverage of their FTAs and in the effectiveness of those FTAs at liberalizing the trade of goods and services or providing for a broader set of nontrade strategic interests. For the small and medium-sized countries in this quadrant, this may be because of a greater desire to protect fledgling domestic industries—though the industries protected by higher tariffs tend to be broader and less targeted among independent movers relative to targeted allies. For example, Türkiye’s partial customs union with the EU focuses on industrial sectors, providing ample room to protect high-priority sectors such as agriculture.
Mainland China is a limited user of FTAs due to its size and economic clout. Its strategy is to rely on its scale and competitive cost position to access foreign markets on WTO-only terms. Another large country, India, also has not yet made FTAs an important part of its trade strategy—although this is now changing, as evidenced by new FTAs with Australia and the UAE and ongoing negotiations with other partners.
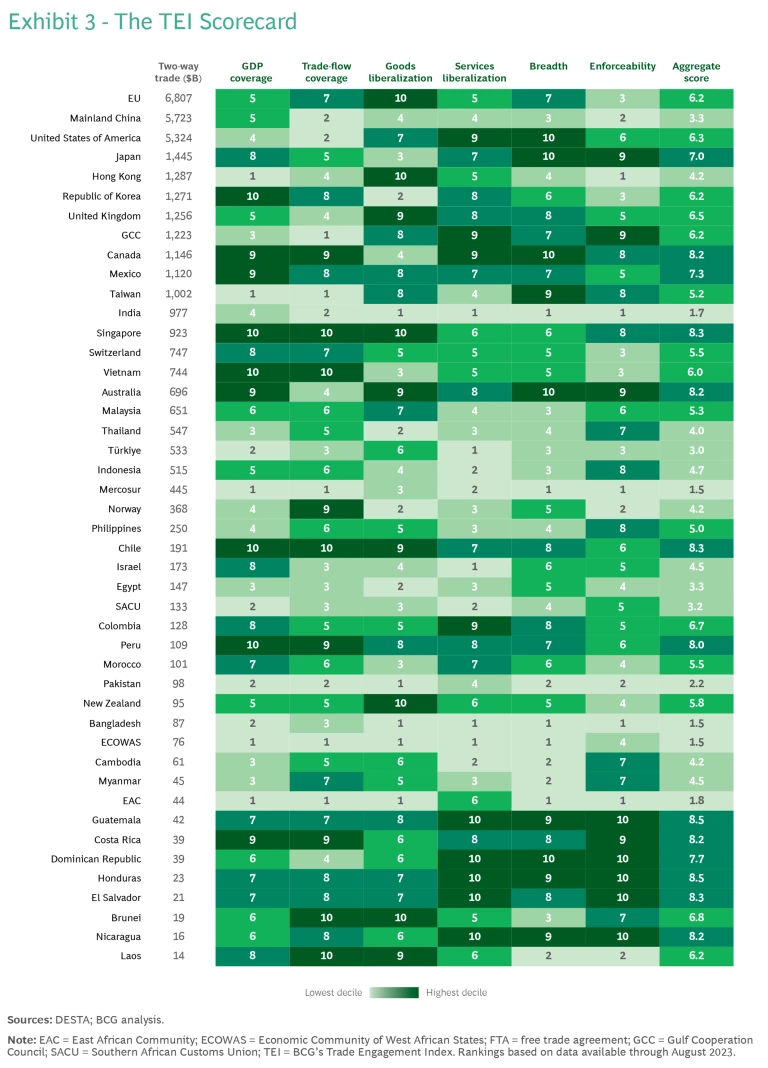
We’ve compiled the TEI scores of over 40 governments and trade blocs to show how their trade agreements compare across our six measures of trade engagement and effectiveness. (See Exhibit 3.)
How Companies and Governments Can Benefit
The global array of trade agreements can be confusing, in part because countries enter trade agreements with different objectives and rely on them to different degrees based on their broader trade strategies. These differences, in turn, have tradeoffs and implications for both private- and public-sector stakeholders.
Companies that are assessing their global sourcing and manufacturing footprint can use the Trade Engagement Index to:
- Compare governments’ trade strategies and FTA networks to assess the potential implications for the economics and risk profiles of their global value chains.
- Help make future decisions about their global sourcing and manufacturing footprint.
- Determine which manufacturing locations have the greatest market access based on preferential trade terms (for example, lower or zero-rated tariffs).
- As new trade agreements are announced, companies can use the BCG TEI to establish a baseline to determine where they can seek to shape the policies in future trade agreements to benefit their global value chains.
In the public sector, governments can use the TEI to:
- Understand where they fit among the trade-profile archetypes and use the information to improve their own competitive position and attract new investment.
- Ensure agreements are crafted and implemented in such a way that businesses can and want to take advantage of them.
- Align trade policy, industrial policy, and inward investment-policy objectives to maintain competitiveness in attracting global manufacturing installations.
Countries are increasingly looking to adapt their trade strategies to respond to the challenges and opportunities presented by recent shocks to the global trading system. As trade agreements proliferate, the impact on countries’ economic competitiveness varies widely.
By taking a multidimensional view of the comparative qualities of different FTAs and the strategic motivations behind them, businesses and governments alike can address risks and maximize the benefits of this more complicated era of global trade.


