Editor’s note: When originally published in January 2024, this article estimated, on the basis of a discrepancy in the GDP data, that global trade would grow slightly less than global GDP in 2022-2032; the GDP growth forecast since has been revised.
As the global economy adjusts to persistent economic and geopolitical pressures and disruptions, the familiar routes that defined the world trade map are being redrawn and trade blocs are playing a greater role. In addition, overall global trade is growing at a slower rate than the world economy, a fundamental shift away from the trend of trade-led globalism that has been prevalent since the end of the Cold War. (See “BCG’s Global Trade Model Methodology.”) World trade in goods is forecast to grow at 2.8% per year, on average, through 2032, compared with an estimated 3.1% growth rate for global GDP in the same period, according to a new BCG analysis. (See Exhibit 1.)
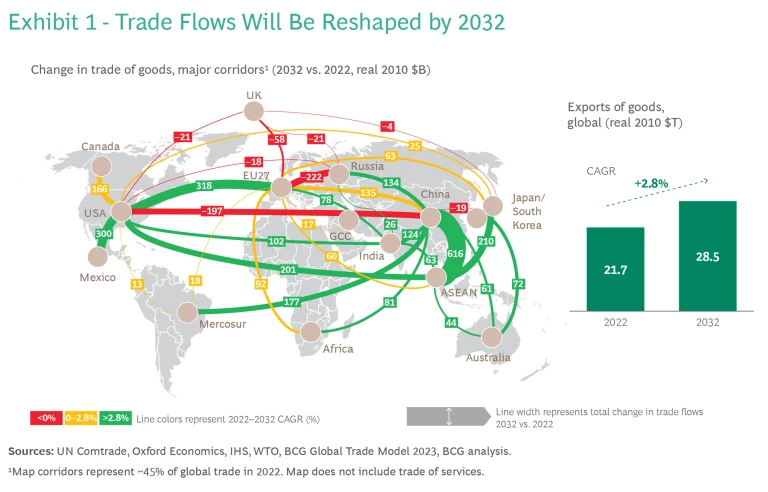
BCG’s Global Trade Model Methodology
This year’s trade model includes a number of improvements:
- Trade values are indexed to 2010 to reduce year-to-year volatility, in line with best practices of intergovernmental organizations.
- AI and machine learning are used to create a more detailed model by tracking nine different macroeconomic variables over a 20-year period.
- Impacts of newly present influences, such as new trade agreements, trade wars, military conflicts and related sanctions, and climate-related trade policies, are captured on a case-by-case basis, and adjustments are applied to certain future forecasts.
Assumptions
The 2023 model includes certain notable geopolitical assumptions, including:
- The ongoing sanctions regime against Russia and Belarus remain in place through 2032.
- The EU and US stop trading with Russia for the forecast period, except for critical supplies.
- The European Union’s “REPowerEU” achieves its goal of terminating EU energy imports from Russia by 2030.
- Russia trade is diverted mainly to China, India, and other emerging markets.
- Trade sanctions from the West curtail Russia trade with the EU, US, UK, Japan, and South Korea.
- No significant new trade agreements are established in the 2023–2032 period.
- The EU implements its carbon border adjustment mechanism (CBAM) in 2026 and deforestation regulation in 2025 as planned.
- ASEAN trade
- ASEAN-US and ASEAN-EU exports rise at a faster rate than in the past due to a reduction in the growth of China exports to the US and the EU.
- India and ASEAN rise as destinations for the “China + 1” strategy.
- US industrial policies, such as the Inflation Reduction Act and the Infrastructure Investment and Jobs Act, promote clean energy and Tier 2 materials trade.
- The US Mexico Canada Agreement and SEC 232 tariff exemption boost US regional trade with Mexico and Canada.
Regional Definitions
- The European Union includes all 27 current member countries.
- Gulf Cooperation Council includes Bahrain, Kuwait, Oman, Qatar, Saudi Arabia, and United Arab Emirates.
- ASEAN includes Brunei, Cambodia, Indonesia, Laos, Malaysia, Myanmar, Philippines, Singapore, Thailand, and Vietnam.
- Mercosur includes current active members, Argentina, Brazil, Paraguay, and Uruguay.
- Africa comprises all countries of the African Continental Free Trade Area (AfCFTA).
The emergence and growing prominence of trade blocs is having a dampening effect on traditionally deep and fast-growing trade lanes such as China-US and China-EU. Five emerging global trade dynamics will characterize the world in the coming decade. (See Exhibit 2.)
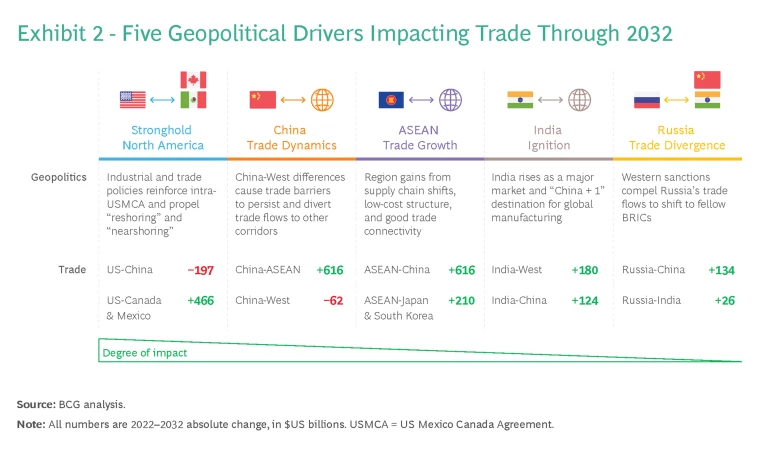
Stronghold North America
The United States, Canada, and Mexico will benefit from the US Mexico Canada Agreement (USMCA), as US trade with its neighbors is forecast to grow by $466 billion in the coming decade. Faced with a combination of economic pressure and national security concerns, the Biden administration has adopted a new focus on industrial policies with a more protectionist bent, such as the Infrastructure Investment and Jobs Act (IIJA), CHIPS Act, and the Inflation Reduction Act (IRA). The result is a more influential regional manufacturing footprint with direct investment into strategic industries.
China Trade Dynamics
Persistent trade tensions and growing trade barriers are continuing to impact trade between China and the West. The projected fall-off in US-China trade is one of the most significant developments in the updated global trade map, with 2032 trade value forecast to fall $197 billion from its 2022 level. This is more than three times the $63 billion contraction forecast one year ago in a similar BCG analysis. The change is due to China’s slowing GDP growth in 2022, combined with other factors. China’s trade with the EU will continue to grow, but more slowly than the global average.
ASEAN Trade Growth
Southeast Asian nations are among the biggest winners in the new world trade order. Cumulative ASEAN trade is forecast to grow $1.2 trillion in the next ten years due to the region’s emergence as a key destination for companies seeking to decrease their dependence on China for manufacturing by adopting a “China + 1” diversification strategy. ASEAN is an attractive China alternative because of its young and dynamic population, economic diversity, and generally neutral stance among geopolitical blocs.
India Ignition
Like the ASEAN nations, India is benefiting from a low-cost structure and capable workforce to rise as a major domestic market and “China + 1” destination for global manufacturing. India’s large market and particular strength in industries such as chemicals, consumer electronics, and pharmaceuticals are attractive for companies seeking to diversify their global footprint. Expanding trade connectivity, as evidenced by new and under-negotiation trade agreements, are helping to increase India’s projected external trade in the next ten years by $393 billion, including $180 billion with the US and EU and $124 billion with China.
Russia Trade Divergence
The break in Russia’s trade with the EU and the US caused by the war in Ukraine and the resulting sanctions and reduced European dependence on Russian energy will influence Russia’s trading profile at least so long as the stalemate in Ukraine continues. These conditions have not led to the elimination of Russian trade, but rather its redirection elsewhere. For example, much of the trade with the EU has shifted to Russia’s fellow BRICs countries: Brazil, China, India, and South Africa. While Russia’s trade with the EU in 2032 will fall by $222 billion, compared with 2022, its trade with China and India will grow by $134 billion and $26 billion, respectively.

Multiple Challenges Are Inhibiting Trade Growth
The cooler trade climate is part of a reordering of the world trade map that is taking shape in the wake of the recent twin shocks of the pandemic and the Ukraine war, accompanied by a rise in trade protectionism and a falloff in globalization sentiment. A variety of factors are contributing to reshoring of manufacturing around the world, with a predictable dampening effect on global trade. These include:
- Industrial policy. A leading element is the rise of national policies designed to support domestic industry and job creation. Policies such as the United States’ Inflation Reduction Act (IRA), with its “Buy American” incentives, reflect governments prioritizing national interests over multilateral, rules-based organizations, such as the World Trade Organization. Similar policies can be seen in the European Union and other parts of the world.
- Labor economics. Companies in some regions are taking advantage of capable, low-cost labor as well as the availability of new technologies that have enabled them to reshore or near-shore manufacturing operations. For example, the cost gap between US and Chinese labor has narrowed as labor costs in China have risen on a relative basis, while locations such as Mexico, Southeast Asia, India, and Latin America have become competitive with China on labor costs.
- Supply chain stability. Faced with risks of disruption and overreliance on extended and brittle supply chains, companies are seeking to diversify their global manufacturing and sourcing networks by moving to markets with lower geopolitical risk, reliable infrastructure and, in some cases, proximity to end-markets.
- Environmental factors. Global and domestic pressure on industry to decarbonize operations has led companies to focus on geographies with clean energy supplies, reduce carbon footprints, and increase overall sustainability. Policies such as the EU’s Green Deal are incentivizing European companies to use more low-carbon energy sources by locating manufacturing closer to home.
As Cooperation Cools, Regional Trade Blocs Rise
A characteristic of the new world trade order will be the growing prominence of trade blocs—especially North America, the EU, ASEAN countries, and potentially the BRICs—as production moves closer to end markets. Blocs are attractive for countries seeking to limit geopolitical friction by trading with entities seen as “friendly” partners, especially where trade agreements exist, such as the EU, USMCA, Comprehensive and Progressive Agreement for Trans-Pacific Partnership, Regional Comprehensive Economic Partnership, and EU-Vietnam Free Trade Agreement.
Under the Biden administration, the US has adopted new industrial policies, with legislation that encourages direct investment in strategic industries such as semiconductors, domestic manufacturing, renewable energy production, and electric vehicle infrastructure and battery technology.
Combined with the USMCA, the net effect of these industrial policies is to pull investment back to the US—especially for industries deemed critical to national security, like computer chips. Trade between the US and Mexico stands to grow by an impressive $300 billion over the coming decade. The Inflation Reduction Act, for example, goes beyond familiar “Buy American” incentives to encompass a “Buy North American” approach, such as extending the $7,500 credit for electric vehicles with powertrains or battery technology made in the US, Canada, or Mexico.
Among the biggest impacts of increasing emphasis on resilience through diversification of global markets and supply chains will be a continued fall-off in trade between China and the United States, as companies seek trading partners and manufacturing locations to rebalance their global risk exposure.
As the world’s leading exporter of manufactured goods, China itself is resilient. Trade that stops flowing between China and the West will simply move elsewhere. Notable beneficiaries of reduced US concentration in China will be the ASEAN countries and India as many companies move manufacturing to these economies, both to reduce global supply chain risks and to access new markets. As a result, trade between ASEAN and China will grow a remarkable $616 billion in the coming decade—and trade between ASEAN and both the US and Japan will increase by more than $200 billion. India is forecast to achieve 6.3% average annual trade growth, partly because of this rebalancing of China trade.
“No-Regrets” Moves to Improve Preparedness and Competitiveness
As trade frictions grow and trust in multilateralism weakens, the global market is becoming more fragmented. The more cooperative trade environment that enabled companies to build global supply chains in recent decades is quickly being replaced by a more uncertain world characterized by a mix of smaller regional and local supply chains. In the short term, companies should take several steps to adapt.
- Strengthen geopolitical decision-making capability to enable supply chains to withstand disruptions. Companies can improve resilience by investing in digital tools, such as artificial intelligence, to enable agile decision-making and adaptability. Companies can also take steps such as building buffer inventories of essential commodities, prequalifying alternative suppliers, and planning contingencies for at-risk supply inputs.
- Enhance ability to respond to price volatility and inflation. Strategies can include building resilient pricing , such as by sensing demand shifts earlier and developing dynamic pricing capabilities, strengthening customer relationships and contracting flexibility, and exploring new monetization models, including “as-a-service” models and outcome-based pricing.
- Become more flexible and adaptable by adopting “fractal innovation.” To help meet the challenges of a fragmenting global trading landscape, companies can address differentiated needs of local customers by adopting a “customer-in” approach and embracing a new way of designing products—something we call fractal innovation .
- Turbo-charge risk and cybersecurity capabilities. Companies should identify security gaps, prioritize security projects and tools, and consider approaches such as a cyber tool health index, zero-based budgeting, and cyber risk quantification to develop a custom cybersecurity roadmap .
Forces that have had a dampening effect on global trade in recent years will continue to be a factor in the world economy and corporate decision-making. Companies that rely on global supply chains must recognize that the challenges afflicting global trade are here to stay, and should continue to diversify their networks and build resilience.