Across industries and regions, manufacturers are facing pivotal investment decisions about their plant and distribution networks. Many are contending with underutilized, outdated facilities that no longer meet energy efficiency standards. These challenges are compounded by the need to incorporate sustainability and resilience into network design—alongside the familiar priorities of cost, service levels, and growth.
The path to future-proofing manufacturing networks lies in finding the right balance between new goals and traditional objectives while ensuring the flexibility to adapt as needs evolve. Analysis conducted by BCG—and accounts of leading companies’ efforts to update their networks—reveal a clear opportunity to capture significant financial gains. Companies can boost EBITDA by 1 to 3 percentage points by combining savings from CO2 reduction with cost improvements from traditional initiatives, such as optimizing scale and logistics.
Designing the optimal network is a complex and sensitive task. Success requires a data-driven, fact-based approach that carefully navigates the competing priorities to unlock real value.
Designing Networks to Optimize Five Critical Factors
In addition to the traditional issues of cost, service, and growth, manufacturers now also must address sustainability and resilience. This expanded set of objectives challenges the assumptions that underlie previous network optimization efforts.
1. Costs
Manufacturers seek to optimize the costs of serving their markets today and in the future. This involves identifying the optimal product-to-factory allocations and leveraging scale effects; managing logistics costs by positioning facilities close to raw materials, suppliers, and customers; or adapting products to reduce freight loads. Additionally, manufacturers strive to minimize production costs, including those related to labor and energy.
2. Service Levels
Maintaining appropriate service levels is crucial to ensure short, reliable lead times and the flexibility to adapt to changing orders. Designing networks to optimize both costs and service levels has played out differently across industries. For instance, the cement industry often has a decentralized network with strong regional proximity to customers, while the pharmaceutical and automotive industries may operate with more centralized networks that rely on global shipping.
3. Growth
Manufacturers seek to unlock growth and capture new business opportunities. This involves designing innovative products, adapting to customers’ evolving needs, and investing in new markets to improve proximity to customers and tap into new workforce pools. However, successful growth initiatives often create new demands on manufacturing networks, requiring adjustments to the operational footprint to keep pace.
4. Sustainability
The push for sustainability is coming from both consumers and governments. As consumers become more aware of the steps needed to create, package, and ship a product—and their environmental impacts—manufacturers need to enhance the transparency of their end-to-end supply chains. Governments have introduced a variety of decarbonization requirements and regulations across different regions, covering emissions, circularity needs, and water, among other topics. New European regulations with significant impact on industrial players include the Carbon Border Adjustment Mechanism (CBAM), the EU Green Deal, the Corporate Sustainability Reporting Directive, and the Corporate Sustainability Due Diligence Directive. In addition to increasing regulations, many jurisdictions, including the US, have implemented incentives for manufacturers to invest in clean energy and decarbonization.
However, the continuing evolution and widely varying cost projections of many decarbonization technologies—such as carbon capture, utilization, and storage (CCUS); green hydrogen; and circularity solutions—add a degree of uncertainty to manufacturers’ sustainability planning. Additionally, they must consider the availability of raw materials and green energy sources. These factors make decarbonization investment decisions highly complex and strategic choices, requiring consideration of regional regulatory and non-regulatory cost implications and technological advancements over the next 10 to 15 years. If customer demand and willingness to pay justify the higher costs of green inputs that are not yet available at scale, companies may capture a first-mover advantage that drives higher margins.
5. Resilience
Manufacturers face supply chain disruptions arising from geopolitical instability, natural disasters, fluctuating demand, transportation bottlenecks, and evolving regulations. At the same time, the effects of climate change —including extreme weather events, drought and water stress, and rising sea levels—have increased physical risks for supply chains and manufacturing sites.
To ensure product supply in the face of such disruptions, manufacturers must investigate ways to increase their resilience. Many levers are available. In sourcing, they can optimize raw material inventories, diversify their supplier base across regions, encourage suppliers to relocate, and qualify new suppliers to enable dual sourcing. For production, they can qualify backup contract manufacturers, expand manufacturing capabilities, and reshore, nearshore, or regionalize plants. Finally, in delivery, companies can optimize finished goods inventory, add redundant distribution partners, reconsider transportation methods, and move warehouses closer to end markets. Because improving resilience often entails significant investments, manufacturers must select the most cost-effective levers for achieving their objectives.
Optimization Generates Significant Financial Impact
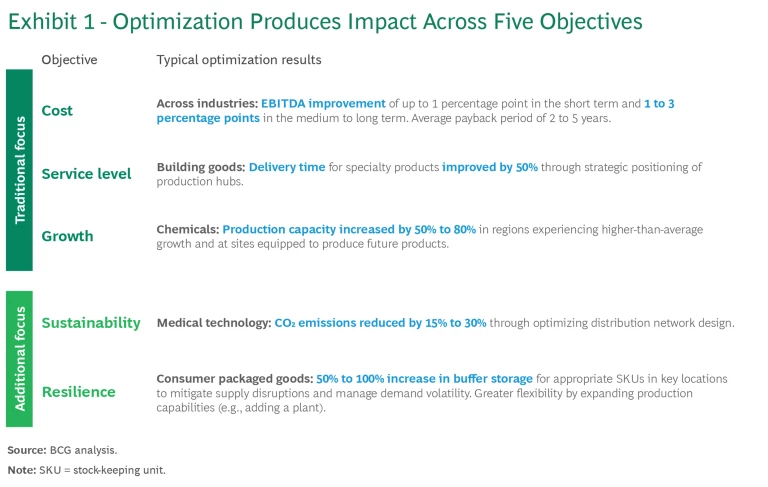
Although the impact of network optimization varies by industry, it consistently promotes impressive financial and non-financial benefits for each of the five objectives. (See Exhibit 1.)

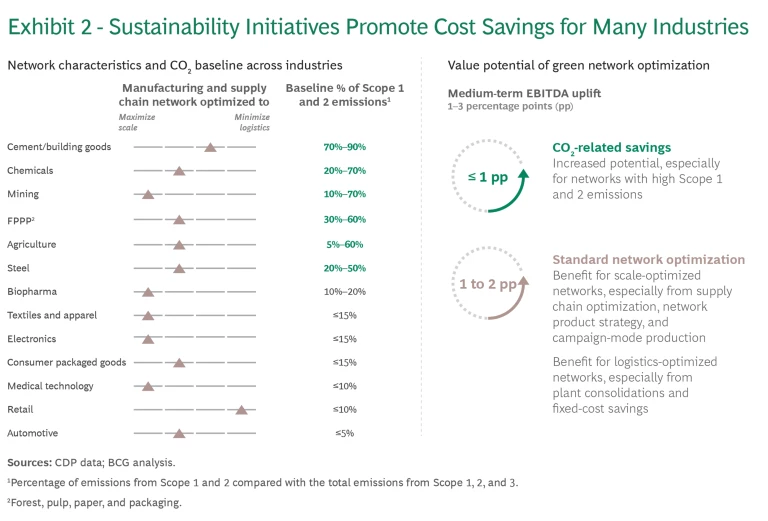
Analyzing network characteristics and CO2 baselines across industries, we found that the EBITDA uplift from green network optimization was at least 1 percentage point, especially for networks with high Scope 1 and 2 emissions. (See Exhibit 2.) A leading building goods producer has demonstrated the full range of benefits generated by network optimization, including EBITDA uplift and meeting sustainability goals. (See “Plant Network Optimization at a Global Building Goods Producer.”)
Plant Network Optimization at a Global Building Goods Producer
The project team defined a target for its optimized manufacturing plant network by evaluating regional demand scenarios and raw material logistics (including sourcing alternative materials), running multiple sensitivity analyses, and considering four quantified scenarios for the future network. The team also considered regulatory changes in the US and Europe and the requirements for CCUS infrastructure. For example, the team used BCG’s CCUS Hub tool to define possible hub areas based on estimates of carbon cost per ton, including capture, transportation, and storage.
The anticipated benefits include:
- Improvement in EBITDA. The project identified a potential EBITDA uplift of 2 percentage points.
- Effective decarbonization initiatives. The producer confirmed and prioritized decarbonization measures. These measures will allow it to avoid inefficient CO₂ upgrades at non-strategic locations.
- Right-sizing the plant network. The project team recommended the closure of approximately 15% of its production units, with an average payback period of two to five years.
- Capacity upgrades. The project pinpointed capacity upgrades at key locations and identified further medium- to long-term opportunities to import products, thereby avoiding costly investments at some sites.

A Quantitative Approach to Optimization
Plant network optimization is a complex task for most industries, often involving sensitive issues such as plant closures, relocations, and new construction. To consider the multiple objectives effectively, companies need a quantitative, fact-based approach that includes several steps.
Create transparency and establish guardrails.
Understand market demand and supply chain dynamics as well as the decarbonization mandates across regions. Gain transparency into your CO2 footprint and targets as well as the relevant regulations—and use these insights to define the path to net zero emissions.
Identify customer demands and service-level expectations, and analyze how competitors are seeking to meet these. Establish baseline costs, including plant and logistics expenses, and implement strategic guardrails (such as requirements for proximity to markets or local manufacturing).
Companies can use a variety of tools to create transparency and drive results. (See “A Global Medtech Player Assesses and Improves Its Distribution Network.”)
A Global Medtech Player Assesses and Improves Its Distribution Network
The project team conducted a baseline assessment, evaluating the current distribution network’s performance using analytics and visualization tools, such as Alteryx and Tableau. This assessment identified logistical flows and pinpointed key demand centers. Leveraging data-driven insights and the Supply Network Optimization by BCG X tool, the team created and evaluated various footprint scenarios. The modeling results offered objective recommendations and identified key implementation milestones and success factors.
This comprehensive optimization approach allowed the company to reduce costs, improve efficiency, and enhance sustainability across its global distribution network.
The significant improvements included:
- Better customer service. The company fulfilled approximately 80% of demand within 1,000 kilometers of distribution centers.
- Improved resilience. Dedicated distribution centers and backups were established for key markets.
- Increased cost efficiency. The project boosted productivity by 12% to 15% through optimized routing, better warehouse utilization, and reduced transportation expenses.
- CO₂ emissions reduction. The company reduced CO₂ emissions from freight operations by approximately 30%.
Identify options and the target network.
Identify three to five potential network configurations that optimize allocation of the product portfolio across plants. Considering these configurations, create an initial list of plants to construct and receive investments and/or to build, relocate across borders, or close.
Evaluate the list qualitatively and quantitatively, considering feasibility, implementation risks, and financial potential. For the top-ranked options, assess the potential risks, such as competitor actions, cheaper imports, macroeconomic shifts, supply risks, circularity requirements, and sustainability challenges (for example, access to green energy and technologies and changes to decarbonization regulations).
Apply the insights to design the network for the short, medium, and long terms. Evaluate the financial impact in terms of recurring savings (including CO2-related cost impact) and one-off savings, as well as the impact on CO2 emissions. Marginal abatement cost curves (or MACCs) are a powerful tool for comparing the potential cost and emissions impact of decarbonization levers.
Resilience is also an important consideration, especially for companies strongly affected by changing geopolitical dynamics and more frequent natural disruptions. For example, we used an advanced analytics tool, Supply Network Optimization by BCG X , to analyze the operating costs and delivery performance (measured in average mileage to the customer) of a pharma company’s distribution network. The analysis found that, if disruptions occur, resilience-optimized networks pay off by providing lower costs and better performance. If the risks of disruptions are relatively low, however, a cost-optimized network or a balanced network is a better choice.
Define the roadmap and levers.
Create a roadmap for actions across time horizons. Determine specific levers, responsibilities, and timelines for each plant and region. Establish key milestones and checkpoints to track progress. These measures can help identify bottlenecks early, allowing for proactive adjustments. There are many potential sources of bottlenecks, including delays resulting from the need to source green energy, build new plants or adjust capacity in existing plants, negotiate with workers councils, or increase stock to prepare for machine transfers. Additionally, developing a clear plan helps to mitigate risks, such as plants falling behind on sustainability targets or misaligned incentives across regions or plants.
Set a Clear Path for Your Optimization Efforts
Optimizing a manufacturing network to meet 21st century objectives is a considerable undertaking that requires understanding where you are now, where you want to go, and how. Company leaders should be able to answer the following questions about their current network and potential optimization efforts.
- Have we conducted a full review of our entire plant network and distribution network in the past two to three years? Have we determined the potential EBITDA improvement opportunities by optimizing them?
- Are all plants in our network utilized at 80% capacity or higher? What do projections show for the next ten years?
- What is the impact of all announced or potential decarbonization and circularity requirements and regulations affecting our plant network?
- What are the specific timelines to apply for government funding for decarbonization initiatives? How might these timelines impact our planning and implementation of these initiatives?
- What are our decarbonization targets for 2030 and 2035, as well as over the longer term? Do we have a plan to achieve them?
- What is the optimal amount, location, and timing for capital expenditures to ensure that our network stays compliant with sustainability requirements and competitive over the next 10 to 15 years?
- Does our organization have strong enough behaviors and culture to maintain an optimized network over the long term? What changes and supports might be needed?
For many of these questions, a substantial number of companies cannot provide affirmative or sufficiently detailed answers, pointing to the need for a comprehensive reconsideration of their approach to network design.
By considering the five objectives we outline, utilizing quantitative data and analysis tools, and conducting a critical self-assessment of key factors, companies can unlock the financial potential and non-financial benefits of optimizing their plant networks. Implementation typically takes three to five years, with even longer lead times for larger decarbonization efforts. This means companies must act immediately to capitalize on the opportunities. Those that successfully navigate the optimization challenges will reap significant rewards while also contributing to the long-term health of the planet.


