Hard on the heels of one of its worst value creation performances in recent years, the global chemicals industry delivered a reassuringly respectable total shareholder return (TSR) between 2019 and 2023. Within the overall picture, there were pockets of notable strength and weakness as marked regional differences continued. Furthermore, some chemical companies performed exceptionally well in weak subsectors, while others significantly underperformed in strong subsectors.
To navigate this uncertain and diverse landscape—and secure success in the industry—companies need a value creation strategy that prioritizes revenue growth, innovation, and proactive portfolio management.
An Improving Five-Year Performance
Our latest report on value creation in the global chemical industry has found a meaningful improvement in TSR performance. The industry delivered average annual TSR for the five years to December 2023 of 12%, compared with just 7% between 2018 and 2022. TSR from 2019 to 2023 was better than the prior period for all regions and sectors. Indian and South Korean companies, industrial gas companies, and focused specialty chemical players were the standout performers.
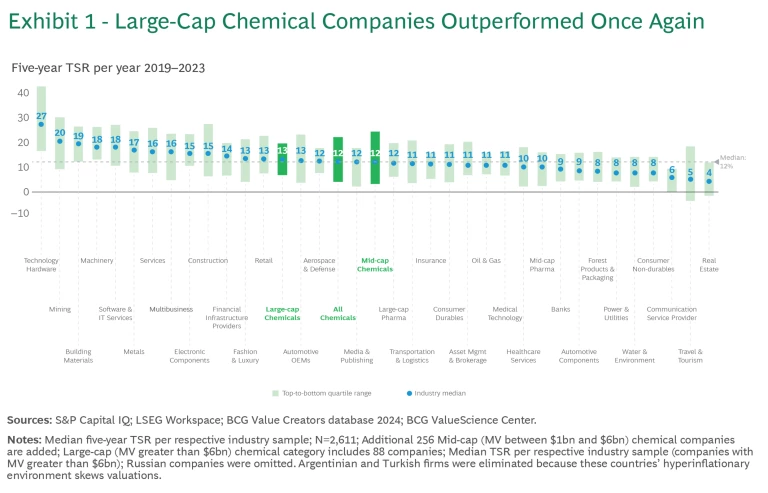
Large-cap chemical companies outperformed mid-cap firms for the third five-year period in a row. (See Exhibit 1). Large-cap players delivered higher TSR, aided by generous dividends—underscoring the benefits of their scale and more efficient resource allocation. However, five-year TSR among mid-cap companies improved significantly, rising from 5% between 2018 and 2022 to 12% between 2019 and 2023. Despite weak EBITDA margins, mid-cap players’ performance was driven by revitalized top-line growth and multiple expansion, signaling greater investor confidence in their future prospects.
For this report, we have analyzed data from 344 publicly listed chemical companies. We have classified large-cap players as having a market value of more than $6 billion and mid-cap players having a market value of $1 billion to $6 billion. Companies typically released data for the last financial year between early and mid-2024. To calculate individual companies’ TSR, we considered the contribution of the various components that make up this metric. (See “How We Calculate and Report TSR.”)
How We Calculate and Report TSR
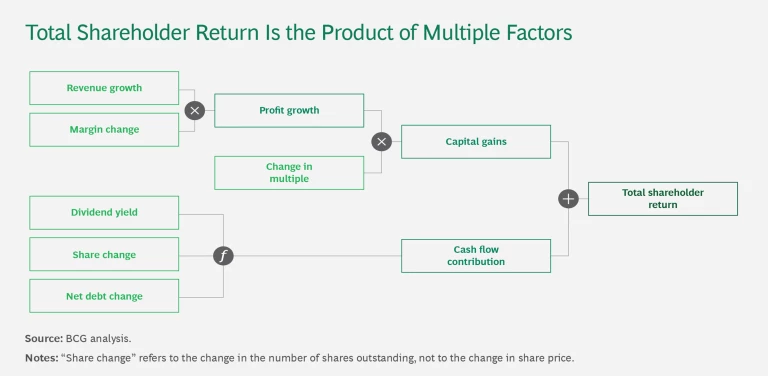
Several factors affect TSR. Readers of BCG’s Value Creators series may be familiar with our methodology for quantifying the relative contributions of the various components of TSR. (See the exhibit.) We use the combination of revenue (sales) growth and change in margins as an indicator of a company’s improvement in fundamental value. We then use the change in the company’s valuation multiple to calculate the impact of investor expectations on TSR. Together, those two factors determine the change in a company’s market capitalization. Finally, our model also tracks the distribution of free cash flow to investors and debt holders—in the form of dividends, share repurchases, and repayments of debt—to determine the contribution of free-cash-flow payouts to a company’s TSR.
All of these factors interact—sometimes in unexpected ways. A company may increase its earnings per share through an acquisition and yet create no TSR if the acquisition erodes its gross margins. Moreover, some forms of cash contribution (such as dividends) can impact a company’s valuation multiple differently than others (such as a share buyback); the effects are complex.
In this report, the TSRs used for groups and for purposes of comparison are generally medians. The TSRs associated with individual companies are straight calculations of those companies’ capital gains—changes in share price value plus dividend value—rounded to the nearest percentage.
Specialty Chemicals and Emerging Markets Led the Field
Focused specialty chemicals, industrial gases, and agrochemicals and fertilizers all performed well at a sector level. Base chemicals and plastics and multispecialty chemicals performed poorly once again. European multispecialty chemical companies particularly struggled. At the same time, the gap between the best- and worst-performing subsectors widened, with a spread of 21 percentage points for the five years to 2023 compared to 18 points between 2018 and 2022.
At a regional level, the global chemical industry continued to display a wide variety of TSR performances. Emerging markets delivered average five-year TSR of 19%, outperforming all other markets—which together delivered 10%—across most sectors. (See Exhibit 2.) India led the pack with TSR of 24%. Its performance was boosted by favorable demographics, robust growth in chemicals demand (starting from low per-capita chemical consumption), supportive policies, and substantial infrastructure investment.
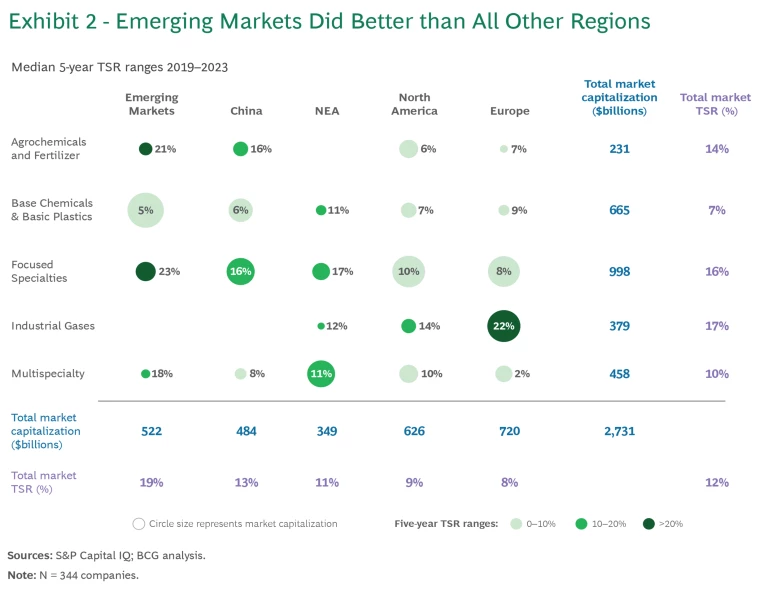
Despite facing a challenging environment last year due to China’s softening economy and weak property market, average five-year TSR for Chinese chemical companies increased to 13% between 2019 and 2023 from 8% between 2018 and 2022. The rise was due to strong revenue growth, on the back of a substantial increase in production capacity, as well as improving valuation multiples.
The effects of China’s enormous capacity expansion (such as in siloxanes, polyols, polyamides, and TiO2) are being felt across global markets. Chinese capacity additions, coupled with softer domestic demand, have not only reduced China’s imports of chemical products but have set the country up for exporting chemicals—especially bulk chemicals. China is already exporting polyethylene terephthalate (PET) and polyvinyl chloride (PVC), among other products, and is likely to start exporting polypropylene (PP) soon. These dynamics have caused a weakening in global prices for these commodity products and have eroded the profitability of non-Chinese players, especially companies with a sizeable European asset footprint.
This situation poses a particular challenge for European chemical companies that compete with Chinese players in these areas and are already grappling with declining margins and decisions about whether to close more plants. (Chinese companies are actively targeting European markets in PET—where they are subject to EU anti-dumping duties on some Chinese PET imports—and increasingly in PVC.) European companies continue to struggle with low demand, a stringent regulatory environment, and the impacts of the energy crisis. Recent M&A deals, however, show that some companies are trying to find creative ways to address these challenges.
Despite these factors, average five-year TSR among European players grew from 5% to 8% in the latest five-year period, although Europe is still placed at the bottom of our regional rankings. However, due to their rigorous cost control initiatives, European chemical companies experienced the lowest margin declines out of all regions between 2019 and 2023. In addition, many companies with a European footprint have a strong global asset network, which allows them to counterbalance the poor financial performance of their European assets with that of their non-European assets.
Northeast Asia chemical companies delivered mixed results. South Korea led the region with average five-year TSR of 22%, while Japan posted a below-average TSR performance of 6% due to large declines in valuation multiples. In North America, TSR increased to 9%, up from 3% in the prior five-year period. The improvement was largely driven by moderate growth in commodity petrochemicals—supported by demand in growing end markets, cheap natural gas, and the impact of US subsidies for green initiatives—as well as higher dividends.
The Middle East’s chemical industry was also severely impacted by China’s increased exports of commodity chemical products, leading to reduced demand for chemicals from the region. In addition, the end of ultra-cheap local feedstocks has exacerbated the challenges facing players in the region and contributed to a decline in revenues and a particularly sharp drop in EBITDA margins. As a result of these factors, five-year annual TSR among Middle East players fell to 1% from 9% in the prior five-year period.
The global industry is likely to face continued oversupply in several commodity products due to China’s ambitious investment strategy and related export activities, combined with softer demand in key industries such as automotive and construction. Unless China is able to re-absorb its additional production capacity by stimulating domestic consumption, this oversupply could prolong the poor performance of players in Europe and the Middle East.
Winners Emerged Even in Weak Subsectors
Our analysis of chemical companies within different subsectors found a wide range of individual company performances. (See Exhibit 3.) Notably, we found no direct correlation between the performance of a subsector—for example, chemical distribution, electronic chemicals, and inks and pigments, all of which are part of the focused specialties sector—and that of the individual companies contained within it.
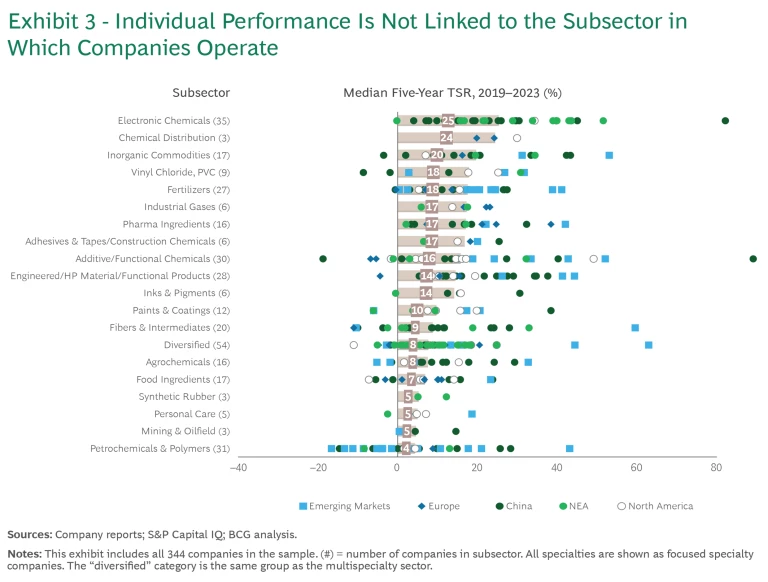
Some subsectors, such as chemical distribution (with a median TSR of 24%), industrial gases (17%), pharma ingredients (17%), adhesives and construction chemicals (17%), synthetic rubber (5%), and mining and oilfield chemicals (5%), delivered positive average TSR despite significant variations between their constituent companies. Meanwhile, some companies in better-performing subsectors still underperformed the industry average of 12%, and some in poor-performing subsectors outperformed the average. Our findings indicate that some companies can thrive, even in a challenging market, through effective strategies.
How Different Subsectors Have Performed Over Time
The chemical industry has seen a consistent pattern where winning and losing subsectors emerge over several time frames. Although the grouping only comprises a few players, industrial gas companies, helped in part by the subsector’s structure, have been standout performers across our TSR rankings, delivering high returns driven by strong EBITDA margins and robust revenue growth. Electronic chemicals players have also consistently excelled—taking pole position over a 5- and 10-year time frame—thanks to the semiconductor supercycle. Revenue growth and healthy margins have enabled them to produce impressive TSR. In addition, the chemical distribution subsector has maintained its status as a top TSR performer over 5-, 10-, and 20-year time frames, helped by stable margins and moderate revenue growth. (See Exhibit 4.)
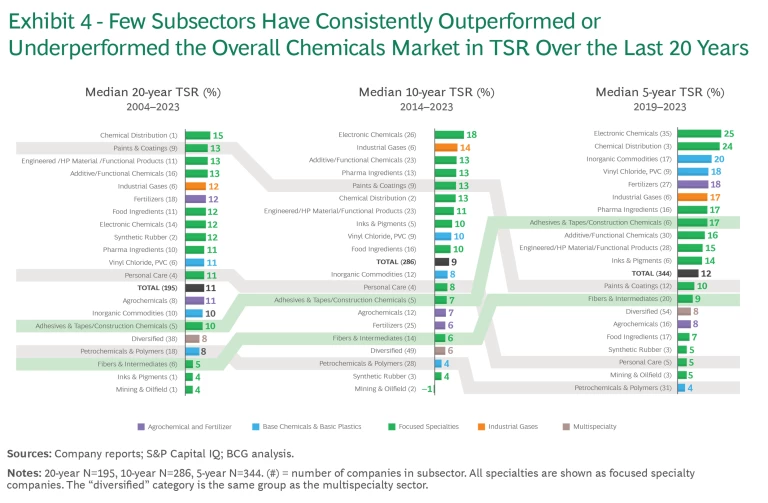
Other subsectors have steadily risen up the TSR rankings over our time frames. These include adhesives and construction chemicals companies, which have been boosted by global construction activity and sustainability trends. For example, players in this subsector have benefited from shifts in industrial production processes, such as the switch from welding and mechanical connections to adhesives in the automotive, electronics, and aerospace industries.
By contrast, petrochemicals companies have consistently been among the weakest TSR performers, particularly in the Middle East. Capacity additions worldwide have resulted in low TSR. Mining and oilfield chemicals and diversified (multispecialty) chemicals have underperformed over the last 5, 10, and 20 years, with multispecialty companies hurt by declining margins. Despite strong trading multiples, the performance of food ingredients players has been mixed. This subsector has produced high valuations but low margins, placing them at the lower end of the TSR range.
This clear distinction between winning and losing subsectors highlights the evolving dynamics within the chemical industry. It also underscores the importance of strategic focus, adaptation to market trends, and active portfolio management.
Growth Was the Key Driver of Value Creation, But Multiples also Played a Role
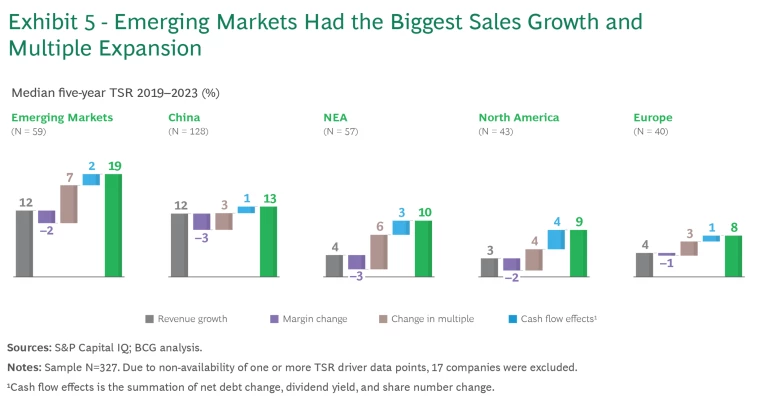
Revenue growth was the main driver of TSR performance across regions, sectors, and in subsectors such as electronic chemicals and agrochemicals. On a regional level, emerging markets (boosted by South Asia) and China were the top performers in terms of revenue growth. (See Exhibit 5.) At the same time, EBITDA margins shrank across all regions. Among our five sectors, margin declines particularly impacted multispecialty players. However, the industrial gases, mining and oilfield, and pharma ingredients subsectors benefited from strong margins. Multiple expansion—reflecting positive market sentiment about companies’ future prospects—was another important driver of TSR performance, both in emerging markets and particularly South Korea, but also in focused specialties.
When we looked at the correlation between companies’ TSR and how they performed on environmental, social, and governance (ESG) criteria, we found there was a particularly strong correlation between high TSR and good corporate governance—underlining its importance to investors.
South Korea was an especially significant outlier. On a regional level, its chemical companies delivered the second-highest TSR after South Asia. However, the average EBITDA margin in the South Korean chemical industry in 2023 was by far the lowest across all regions. Despite this, positive investor expectations about South Korea’s position in future-oriented areas, such as electronics and batteries, led to a strong expansion in valuation multiples which drove TSR performance. (See Exhibit 6.)
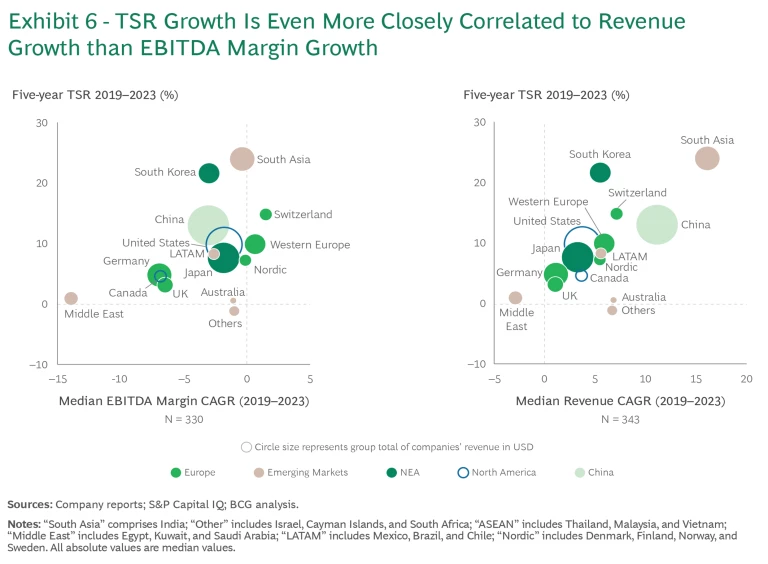
Unlike most regions, which suffered margin declines during the period 2019–2023, South Asia, led by India, was one of only a few with stable margins. The region is consistently ahead of its peer group in terms of TSR and revenue expansion, helped by generous industrial policy support from federal and state governments, a large and increasing population, and a growing middle class. Such divergence between the drivers of
value creation
in different regions underlines the importance of having a clear and robust TSR strategy.
Securing Success in the Chemical Industry Requires a Proactive TSR Strategy
In an era marked by significant challenges and uncertainties, chemical companies must adopt a strategy that can activate all TSR levers. Value creation is growing in importance. Increasingly, company leaders want their medium- and long-term plans to have a clear TSR element. (See “The Rising Importance of a TSR Strategy.”) Using AI, we’ve found that two out of three chemical companies now tackle value creation topics in their earnings calls, with a particular focus on capital levers and cost efficiency measures. Furthermore, the number of companies doing so has increased by more than 10% over the last 12 months.
How We Analyze Company TSR
All of these factors interact—sometimes in unexpected ways. A company may grow its earnings per share through an acquisition and yet not create any TSR because the new acquisition erodes the company’s margins. And some forms of cash contribution (for example, dividends) may affect a company’s valuation multiple more positively than others (such as share buybacks). Because of these interactions, we advise companies to take a holistic approach to value-creation strategy.
To drive successful value creation, companies should be guided by the following key principles.
Prioritize the main driver of TSR: growth.
Rather than relying solely on efficiency improvements, companies should focus on robust growth strategies that leverage end market dynamics and innovations. This involves:
- Tapping into emerging opportunities by aligning growth strategies with strong end-industry sectors to achieve consistent, long-term growth and profitability.
- Investing in innovation and sustainability by developing product portfolios and business models that are supported by key trends, such as circularity and the transition to net zero.
- Rigorously driving commercial excellence and customer focus through efficiency improvements, prioritizing customer needs, and stronger relationships.
- Exploring partnerships and joint ventures along the value chain so that companies can enhance their go-to-market strategies and service offerings.
Pursue continuous portfolio optimization and strategic M&A.
Chemical companies must rigorously adjust their portfolios and actively seek M&A opportunities if they are to remain competitive and achieve reliability of supply and lower costs. As they consider potential targets, they need to ask themselves the following questions: Which segments and regions are most critical to driving our TSR? Should the company focus on fewer steps within the value chain or on more steps—for example, by creating joint ventures, selling or acquiring businesses, and purchasing intermediates (from players with a cost advantage in other regions) rather than producing them in-house?
Smart deal-making and portfolio management involves:
- Identifying and acting on core value drivers by determining where value originates—whether from specific industries, regions, or business models—and making informed decisions about divesting non-core assets.
- Avoiding feedstock dependence. Given the commercial advantages some regions enjoy due to feedstock availability, companies should be cautious about overinvesting in subsectors that are dependent on specific feedstocks.
- Prioritizing strategic acquisitions that enhance market reach, end-industry coverage, and technological innovation instead of focusing mostly on supply and demand-driven M&A.
Optimize capital project management.
Faced with larger and more complex projects, companies need to take a more disciplined capital allocation approach and spend scarce capital on their core competencies and the most promising steps in their value chains. For example, they should rigorously assess their integrated value chains and consider more flexible partnership arrangements when entering new markets or customer segments. In addition, they should prioritize:
- Adopting flexible investment strategies and selectively investing in key areas to maximize returns, while also maintaining flexible make/buy strategies in their value chain operations.
- Utilizing robust project management capabilities, effective decision-making processes, and strong controls and reporting systems to ensure they make the right investment decisions and achieve rigorous execution, thereby helping to shape the future trajectory of the company.
Scrutinize costs.
A successful value creation strategy includes ongoing cost scrutiny to sustain competitiveness and unlock resources for growth. This can be achieved by:
- Applying rigorous zero-based budgeting principles and leveraging new technologies, such as generative AI, which can act as powerful tools for reducing costs and improving margins.
- Evaluating asset networks and sharing services, which enables companies to reduce unnecessary structural costs and channel the savings into achieving their growth objectives.
Over the last few years, successful chemical players have taken bold steps. They’ve reworked strategies, pressure-tested their global asset networks and integrated value chains, closed unprofitable sites, invested in regions offering higher growth, doubled down on efficiency measures and improved internal processes, and increased their exposure to sustainability and the circular economy. To remain competitive, other companies need to follow suit—and developing an effective TSR strategy is a vital first step.
The authors acknowledge the contributions of their BCG colleagues Kanishka Agarwal, Jooyoung Ahn, Robert Blaudeck, Prakash Chandrasekar, Christoph Franck, Jan Friese, Amit Gandhi, Abhrajit Guria, Susumu Hattori, Jingshi Hu, Ryan Jones, Jihoon Kim, Livia Lin, Martin Link, Julia Meisel, Marcus Morawietz, Eduard Pujol, Arun Rajamani, Katarzyna Raszka, Adam Rothman, Mirko Rubeis, Ranu Sharma, Priyanka Singh, Siqi Tang, Yaroslav Verkh, and Han Zhou. They also acknowledge the contribution made by BCG’s ValueScience Center.

