
In the energy sector, the ability to deliver superior shareholder value during the energy transition has become a true litmus test for strategic excellence, outstanding execution, and resilience. BCG’s analysis of total shareholder return (TSR) in the energy sector from 2019 through 2023 reveals significant performance differences. Across energy subsectors, the average annual returns range from 48% to 6%. Within subsectors, we found a 30% gap, on average, between the top- and bottom-performing companies. Top performers consistently created more value than their direct peers in the same macroeconomic context. (See “About the Study.”)
About the Study
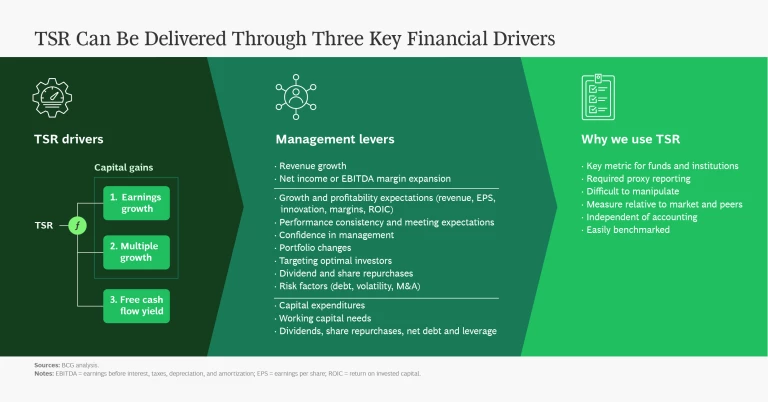
Components of TSR
TSR is a reliable, hard-to-manipulate metric that can be compared across companies. It is measured as the return from a stock investment, with the assumption that all dividends are reinvested in the stock.
BCG’s approach deconstructs TSR into several underlying drivers. (See the exhibit “TSR Can Be Delivered Through Three Key Financial Drivers.”) We use a combination of revenue growth and margin change to assess changes in fundamental value. We then factor in the change in a company’s valuation multiple to determine the impact of investor expectations. Together, these two factors determine the change in a company’s market capitalization and investors’ capital gain (or loss). Finally, we track the distribution of free cash flow to investors and debt holders in the form of dividends, share repurchases, and repayments of debt to determine the contribution of free cash flow payouts to a company’s TSR.
Our Sample and Methodology
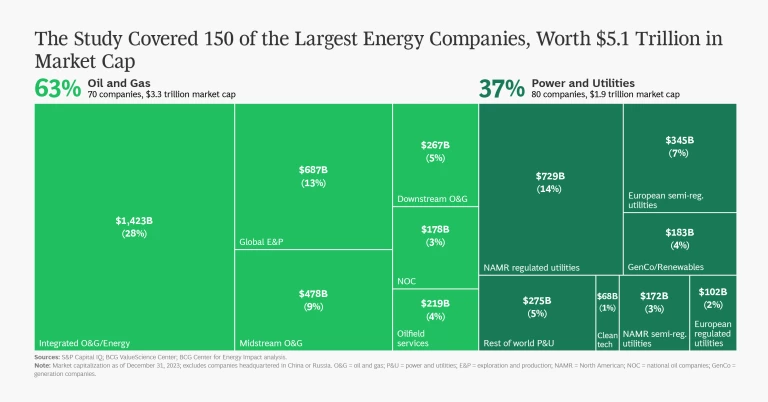
To determine the sample for our 2024 energy company TSR analysis, we began with a list of all publicly traded energy companies across all regions and subsectors. We applied several criteria to filter the list and arrive at the final sample. The 150 companies included in the final sample had a market capitalization exceeding $7 billion, traded at least 20% of their shares in public capital markets, and were publicly listed for the full five-year period of 2019 through 2023. Chinese- and Russian-listed companies are excluded. The total market cap of the sample is nearly $5.1 trillion. (See the exhibit “The Study Covered 150 of the Largest Energy Companies, Worth $5.1 Trillion in Market Cap.”)
TSR leadership is a result of long-term capital allocation decisions. The most successful companies balance capital investment, shareholder distributions, and balance sheet optimization to positively impact TSR. Managing the tradeoffs has become more challenging for energy companies in the face of an accelerating energy transition that requires $37 trillion of investment this decade. To maintain access to equity markets and capitalize on opportunities, companies must also steward shareholder value creation.
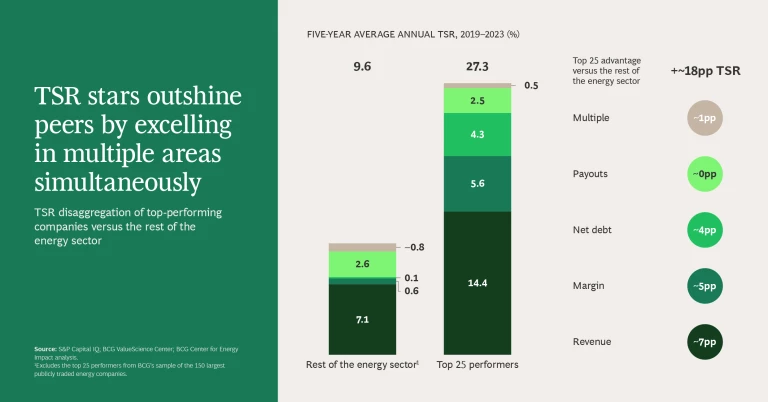
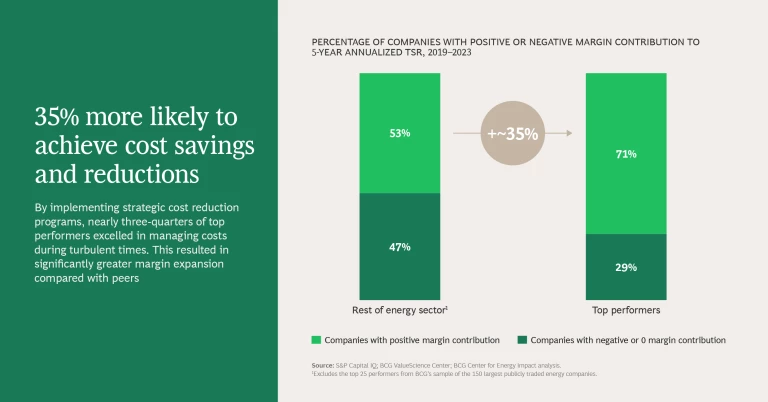
Generating sufficient earnings growth is crucial for value creation, giving companies greater flexibility in cash distribution. Top performers achieved twice the revenue growth and were 35% more likely to achieve cost savings and reductions than their peers. They also allocated capital for balance sheet improvements at twice the rate of peers and maintained shareholder payouts through cycles. Energy companies need to excel in all these areas.
The slideshows below explore these dynamics and highlight the strategies of TSR top performers.
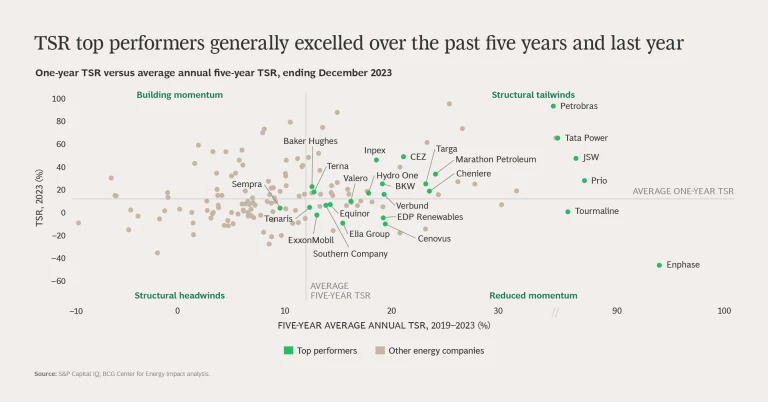
A Wide Range of Performance
As the energy transition progresses, companies are looking beyond traditional peer groups to assess performance, blurring industry boundaries. (See the slideshow “Benchmarking TSR Performance.”) In our study, for example, companies from nearly all energy subsectors are investing in renewable power generation.
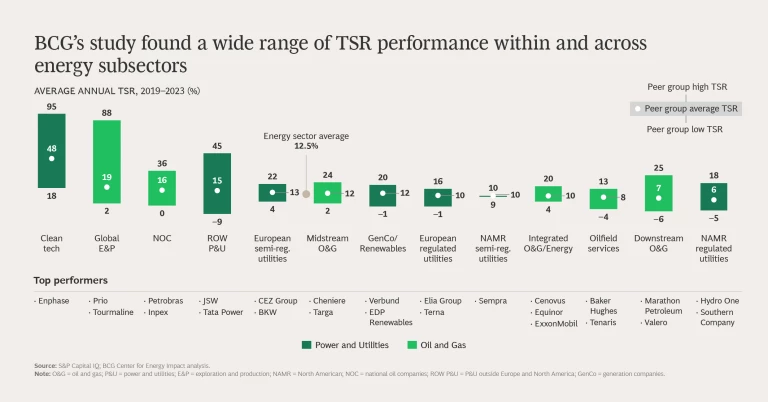
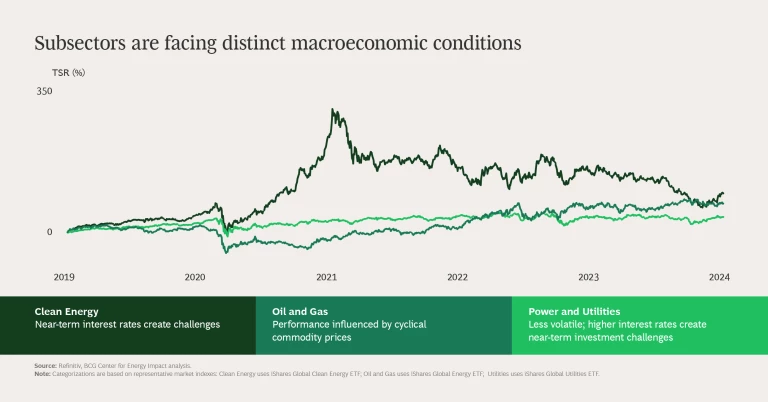
Among these peer groups, clean tech leads with a five-year average TSR of 48%. These companies’ success is driven by accelerated earnings growth and a strong future growth outlook supported by favorable policies, such as those in the US Inflation Reduction Act.
Unsurprisingly, the study also found strong performance by energy peer groups that benefit from higher commodity prices—such as global exploration and production firms, national oil companies, European semi-regulated power and utility (P&U) companies, and P&U firms outside Europe and North America. For these companies, higher commodity and wholesale power prices supported earnings growth and enabled constructive capital allocation programs. In contrast, sectors dependent on commodities as inputs, such as downstream oil and gas (O&G), struggled owing to their negative exposure to a high price cycle.
Regulated utilities, designed for lower but stable long-term returns, had lower-quartile TSR from 2019 through 2023. However, the 23% difference in average annual returns between the top and bottom performers was surprisingly large in an environment of regulated returns. Varying capital allocation choices and evolving regulatory environments led to diverging results.
The TSR performance of integrated O&G and energy companies was generally in the third and fourth quartiles. However, certain companies within the peer group, such as Equinor and ExxonMobil, achieved results within the top two quartiles. Despite the advantage of higher commodity prices, much of the earnings upside was countered by contracting valuation multiples, especially for European companies. This persistent valuation gap between US and European companies remains a significant performance differentiator within this peer group.
Macroeconomic conditions significantly impact performance. Higher inflation, volatile commodity prices, and changing policy and regulatory dynamics affect TSR across cycles. Higher interest rates, for example, have particularly challenged renewable-power-generation groups over the past year, reducing the perceived value of project pipelines. Rising interest rates also posed headwinds for other P&U peer groups, notably regulated utilities, with the number of rate cases in North America reaching an all-time high in 2023. However, returns allowed by regulators have lagged interest rate increases, owing to growing concerns about affordability for customers.
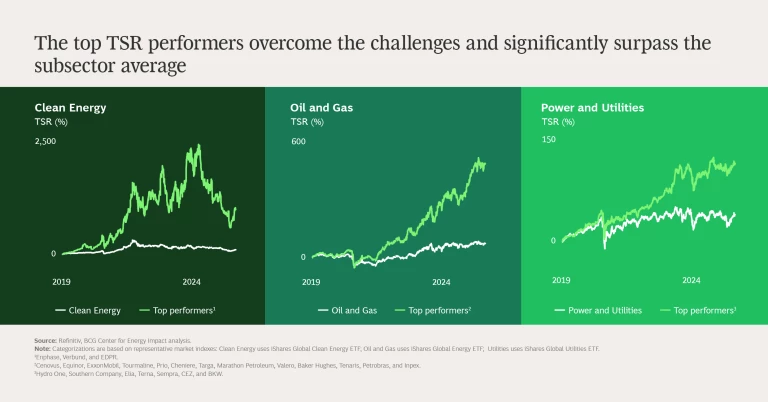
In this environment, the TSR stars’ outperformance was especially impressive. In clean energy, top performers created ten times more value than the market index cumulatively during the five years covered by the study. In O&G, the leaders outperformed by approximately 400%, and in utilities by 77%.
How the Top Performers Excelled
The top performers achieved superior TSR by excelling consistently across the following six dimensions. (See the slideshow “Excelling in Six Dimensions.”)


Revenue Growth: Double Down on Delivery. Top performers delivered double the revenue growth of their peers. Companies across the energy sector achieve growth in various ways: through rate-base growth (regulated utilities and networks), optimizing wholesale market exposure (European semi-regulated P&U), efficient execution of capital projects, and M&A. Despite different approaches, successful companies share common denominators: managing capital projects to reduce risk and maximize earnings; and fine-tuning business models and portfolio strategies to maximize earnings from core and new businesses.
Cost Management: Be Strategic and Systematic. TSR leaders were 35% more likely to achieve cost savings and reductions. By implementing proactive strategic cost reduction programs, companies enhance earnings and performance while building portfolio resilience. This approach leads to significantly greater margin expansion compared with peers. Top-performing integrated O&G companies, for example, utilized proactive and strategic cost reduction programs to drive margin expansion and enable cost competitiveness through cycles.
Balance-Sheet Health: Strengthen Financial Foundations. The top TSR performers were twice as likely to allocate capital to improve balance sheets. They actively reduced debt and maintained financial health, creating resilience against volatile macroeconomic and commodity price environments. Without this resilience, balance sheet stress can directly impact TSR, as companies are forced to take remedial steps such as distressed asset sales, share issuance that dilutes equity, and dividend cuts that impair investor confidence.
Shareholder Payouts: Consistency Trumps Size. Top energy companies were 40% more likely to maintain shareholder payouts through cycles. They distinguished themselves by consistently meeting dividend commitments, even during periods of stress—a trend observed across all peer groups. For example, leading downstream companies accelerated capital returns to shareholders through share buybacks while maintaining and growing dividends consistently. Payout size and the balance between dividends and buybacks were less significant in differentiating TSR.
Valuation Multiple Stability: Prevent Contraction. TSR leaders were 30% more likely to have a growing valuation. Valuation multiples are a headwind in the energy sector, especially in O&G. More than half of energy sector peer groups experienced multiple contraction. Top-performing companies avoided this—and sometimes even achieved expansion—by cementing investor confidence and boosting valuations through a virtuous cycle of de-risked earnings growth, consistent payouts, and balance sheet health. Top-performing European regulated networks, for instance, are growing their regulated asset bases faster than their peers while maintaining balance sheet health and payouts, resulting in a higher earnings growth outlook and premium valuation multiples.
Deal-Making: Use Transactions to Optimize the Portfolio and Business Model. Eighty percent of top performers used transactions to actively manage their portfolios. These companies create value through transactions by selectively pursuing deals that strategically align with their portfolio and capital objectives. For example, leading North American regulated utilities are selling unregulated businesses to focus their portfolios and raise capital to help fund robust transmission and distribution investment plans.
The lessons drawn from the top TSR performers over the past five years offer a roadmap for navigating the energy sector’s unprecedented challenges and opportunities. The top TSR performers surpassed their peers by managing corporate capital allocation tradeoffs effectively among reinvestment decisions, shareholder payouts, and financial health. Ultimately, success hinges on the ability to balance immediate priorities with long-term strategic goals—a balancing act that is more achievable with these tried-and-tested lessons from the sector's top performers.
The authors thank Logan Besuden, Rishi Garg, Sadegh Eghdami, and Margaux Vandenbussche for their contributions to the analyses presented in the article and slideshows.


