
Biopharma is about to feel squeezed. Multiple factors, starting with a steep “patent cliff,” threaten revenues and will put pressure on margins, which are essential to funding ever-more complex and costly R&D.
The 20 top biopharma companies have each invested an annual average of $5.1 billion in R&D over the last 20 years. They have brought more than 800 new drugs to market and vastly expanded the range of therapeutic options available to patients. Shareholders have been rewarded as well, with annual returns averaging 12% a year.
The current threat is sufficiently serious, in our view, that the industry’s ability to unlock the next wave of innovations and to continue its strong record of shareholder returns is at risk. To uphold the margins that will enable historical levels of performance to be matched, top companies need to take a strong, structural approach to costs—starting now.
A Steep Cliff and Other P&L Pressures
Patent cliffs are hardly uncommon, but this one is steep, similar to the last major cliff in the early 2000s. The current cliff, which took shape between 2021 and 2024, means that revenues from drugs still under patent in 2031 will be equivalent to 23% of 2021 revenues (in line with historical averages), but by 2034, that percentage will drop to 10%. (See Exhibit 1.) We estimate that some $150 billion of revenue will be affected through 2027 alone.
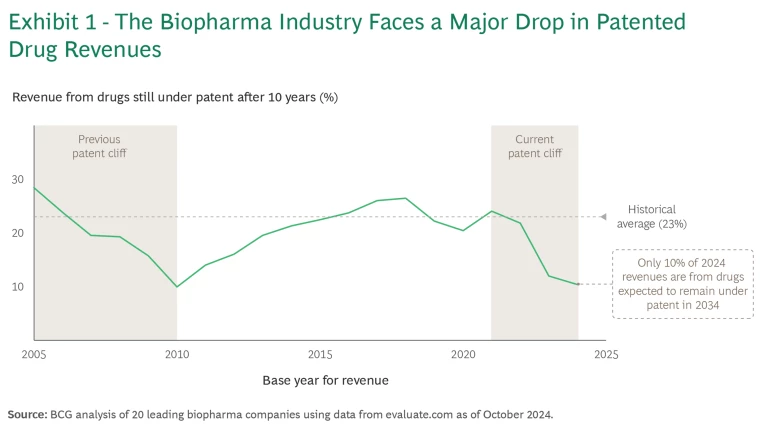
There’s also a big difference this time. Pricing tailwinds in the US were crucial to overcoming the previous cliff. Multiple reasons make similar price increases unlikely today, and the Inflation Reduction Act, passed during the Biden Administration, puts additional pressure on future revenue streams by shortening the exclusivity period for many drugs. (The fate of the law’s drug pricing provisions under the Trump Administration remains to be seen.)
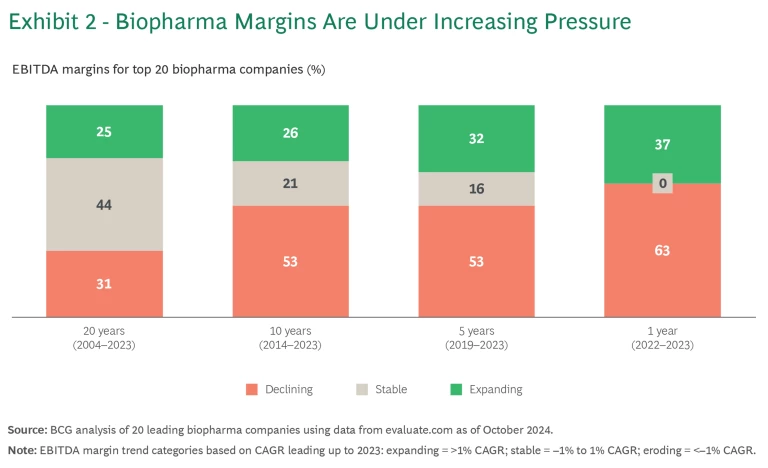
On average, over the last 15 to 20 years, cost gains in other functions have offset significant cost increases in R&D, which has been on a steady productivity decline. The averages, however, mask big differences at the individual company level. (See Exhibit 2.) Over the last two decades, 31% of the top 20 biopharma companies have had declining margins, 44% have kept their margins stable, and 25% have seen margins expand. In many cases, margin expansion has resulted from topline growth driven by the success of individual products, not from cost discipline. Over the most recent ten- and five-year periods, the share of companies with falling margins has jumped to more than 50%.
The patent cliff may be the biggest revenue issue facing the industry, but it is far from the only one. Several other long-term trends are unfavorable for biopharma costs.
Complex Products and Smaller Patient Populations. The industry’s products are becoming more complex, continuing another trend of the last two decades. While offering significant benefits and new avenues of innovation, future products will also be more costly to develop, manufacture, and commercialize. The industry has yet to establish the same experience curve and economies of scale with new modalities that it enjoys with small molecules and traditional biologics. Many new drugs also target smaller patient populations, increasing unit costs across the value chain.
Legislation. Beyond its impact on the top line, new legislation also affects costs. Since the exclusivity clock now starts for the molecule rather than the indication, companies are driven to pursue multiple indications in parallel for a single drug candidate—something that historically was more likely to be done sequentially. This increases risk and the cost of failure, still the biggest driver of R&D expense.
Geopolitics. Shifting geopolitical tensions require rethinking manufacturing networks and supply chains, including reshoring to higher-cost locations and building in more redundancies to strengthen supply chain resilience.
Herd Investing. The industry is following a herd instinct, with multiple companies investing heavily in “hot” technologies and disease areas (GLP-1 agonists and immunology, for example). Competition is fierce. That means companies have to spend more in multiple areas, including identifying patients (in the case of rare diseases), shaping markets (in the case of neurodegenerative disorders), and positioning their products vis-à-vis other market entrants (in the case of obesity).
Subscribe to our Health Care Industry E-Alert.
Tackling Costs to Boost Margins
Since effectiveness typically outperforms efficiency in high-margin businesses, biopharma has been able to maintain its margins through a combination of new-product launches and price increases. This has curbed the development of the industry’s cost-cutting muscle.
For companies that reverse course and start exercising, we see significant margin expansion opportunities, even for today’s more profitable players. Starting points vary, of course, by company and by function within each company. Some companies can achieve big savings in the cost of goods sold (COGS), while others will make the most headway in R&D or general and administrative (G&A) costs. (See Exhibit 3.)
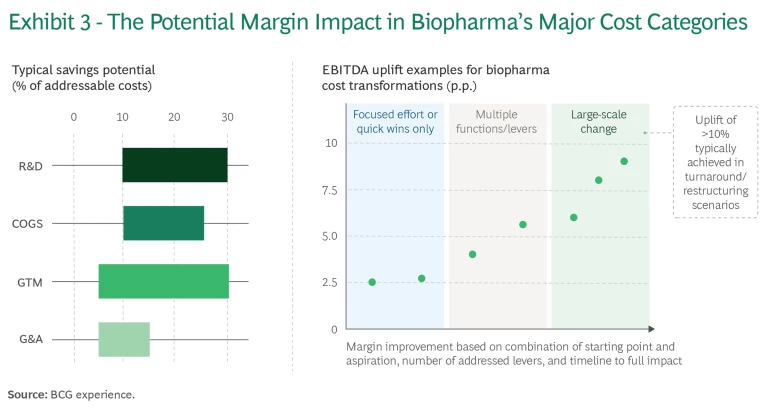
Real-world examples indicate that cumulative EBITDA increases of up to 10 percentage points are a plausible aspiration in transformative, large-scale change efforts. With such an increase, companies with lower margins (say, 20%) can improve to the median of their peers (about 30%), and those peers could propel themselves closer to the ranks of the most profitable players in other technology- and innovation-driven industries (north of 40% to 50%). (See “Prioritizing Cost Control.”)
Prioritizing Cost Control
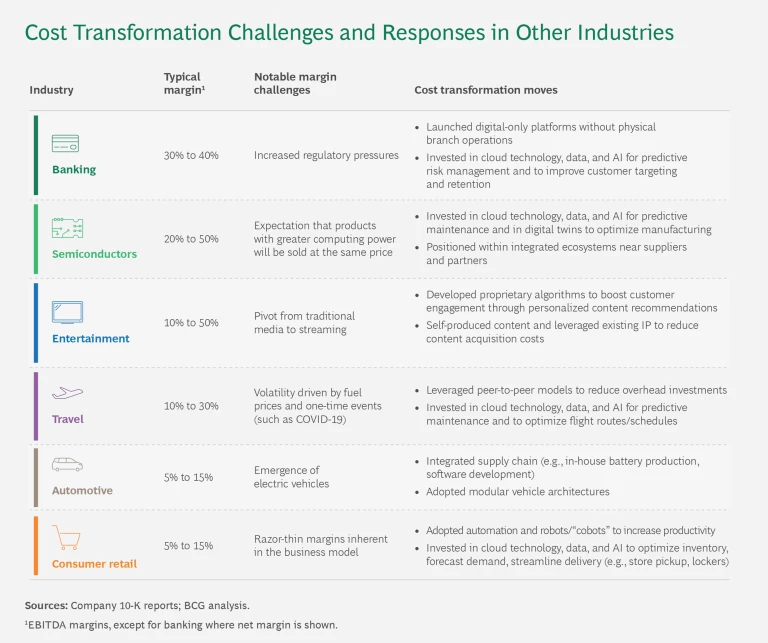
One result is that biopharma companies have not developed the same cost control muscle as companies in other sectors. (See the exhibit.) Indeed, major cost reductions in biopharma have historically occurred in the context of M&A, a legitimate but not particularly inventive lever. Many companies have engaged in one-time cost-out efforts that focus on low-hanging fruit or apply haircuts across the organization. Such efforts provide temporary relief but don’t result in the structural reductions and operating model changes required for sustainable cost advantage. For example, headcount may be reduced but the eliminated positions are replaced with (more expensive) contractors, and organizations grow back to their previous (or larger) size over time.
Undeveloped strengths are never an advantage in a competitive context. Biopharma companies that are too passive on costs amid rising topline pressures could find themselves needing a major turnaround or restructuring to get back on track. Worse, in an evolving industry, a company can lose its attractiveness as a standalone investment. There are countless examples of companies in biopharma and other industries becoming takeover targets because of their cost reduction potential.
Companies that do exercise cost control may also enjoy big advantages. Imagine the value creation potential in biopharma of adopting best practices from other industries and systemically attacking costs across all functions and major P&L cost categories, including R&D, COGS, GTM, and G&A. The kind of margins that characterize high-performing, often technology-based industries are not out of reach for biopharma companies that are determined to develop their cost control muscle.
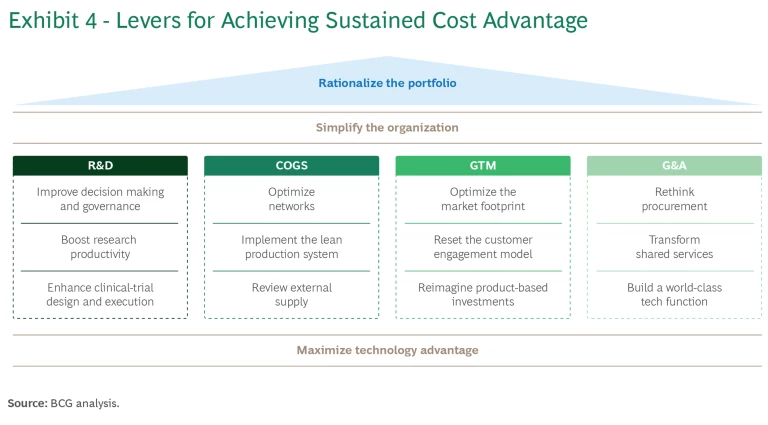
Below, we describe the opportunities for sustained cost advantage in each area, based on our research and client experience. (See Exhibit 4). Specifically, we’re highlighting opportunities in the major operational categories: R&D, COGS, go to market (GTM), and G&A. Companies can achieve additional structural long-term savings with strategic moves to rationalize their portfolios, simplify the organization, and maximize technology advantage, all of which cut across the four operational categories.
R&D
A highly productive R&D engine is the most important growth driver for any innovation-driven enterprise. Most large biopharma companies spend between 20% and 30% of their revenue on R&D. Producing high-impact medicines remains a top priority, but we recommend that management consider the following levers for reducing the cost of failure and making the drug development process more efficient. Together, they have the potential to bring down costs by 10% to 30%.
Improve decision making and governance. Failures stemming from poor safety or efficacy are an inevitable part of the game, of course. But much of the cost of failure comes from poor decision making. Too often, programs advance from one R&D stage to the next without any understanding or assessment of market potential or the probability of success. This is a result of silos across the research, development, and commercial functions. Research teams do not consider viability in the clinic, and development teams do not account for what it takes to position a drug successfully in the market. In our experience, companies can remove barriers to objective, data-driven decision making at all stages of the R&D process, improving their ability to consider relevant input from other functions.
Boost research productivity. Most biopharma companies have reduced their internal drug discovery and design capabilities over the last 15 to 20 years, but their ROI is still not what it should be. We see two root causes. One is an incomplete understanding of where the company is truly positioned to win with internal activities. The other is the inherent biases that favor internal programs over external alternatives.
Companies can set a higher bar for the internal pursuit of disease areas, biologic pathways, and modalities. They can also further level the playing field between internal and external innovation. This includes implementing a system of checks and balances between program teams and functional teams, as well as a control tower capability that serves as the “single source of truth” for innovation sourcing and asset progression.
Enhance clinical-trial design and execution. Most R&D spending goes to clinical trials. Poor design and unnecessary complexity can significantly increase the duration of trials, which drives up costs and prolongs time to market. The reasons are understandable: various functions are looking for data from a trial, each for its own purposes, and it is often difficult to discern which requests are essential (to demonstrate safety and efficacy, for example), which are possibly legitimate but should be discussed (such as requests from commercial to support the go-to-market strategy), and which are questionable.
Poor design and unnecessary complexity can significantly increase the duration of trials, which drives up costs and prolongs time to market.
We recommend that companies run an objective, data-driven assessment to determine a program’s or protocol's optimal complexity. They can also form cross-functional task forces to institutionalize the capability and supporting governance to do this well across the portfolio.
Cost of Goods Sold
For leading biopharma companies, COGS represents about 25% of revenue, although the range can be 15% to 40% depending on portfolio and technology mix. We consider three key levers to be particularly relevant given the latest manufacturing technologies, shifting geopolitics, and changes in global trade patterns and the prices of goods and services. Together, they can help reduce costs by 10% to 25% of the addressable baseline.
Optimize networks. The right network balances reliability, flexibility, and efficiency. Companies historically have prioritized supply chain efficiency, centralizing drug production and packaging. This approach has provided economies of scale and enabled the cost-efficient transport of drugs and their components. It has also created risks by being overly dependent on a few global hubs, which became evident when global trade patterns were disrupted by COVID-19 and geopolitics. In response, some biopharma companies have pushed toward more regionalization of their production facilities, introducing selective redundancies and near-shoring to increase resiliency.
An optimized network should reflect a company’s strategy, based on a transparent analysis of the cost implications, for ensuring a reliable product supply. Today’s networks should also fully leverage the latest technological advances and modular manufacturing solutions that can quickly be scaled up or down.
Implement the lean production system. Lean is gaining traction in biopharma among companies working to increase productivity. These companies aim to eliminate waste and inefficiencies, standardize processes, implement real-time quality control, and build a culture of continuous improvement.
Effective implementation of lean production relies on two critical factors: customization and strong leadership engagement. Implementation should be tailored to each facility’s readiness and complexity so that lean practices can be adopted at an appropriate pace for sustainable results. Leaders should be engaged early to gain support and model behaviors that will secure lasting transformation. For companies that are eager to make quick progress, off-the-shelf systems are available and can substantially reduce the effort required to build new capabilities while improving key operational metrics, including overall equipment effectiveness, time between equipment failures, and batch discrepancy rates.
Review external supply. Biopharma companies face significant cost challenges in external supplies, including rising prices of raw materials, supply chain disruptions, and capacity constraints (especially for particular modalities, such as biologics). The pandemic exposed the risks of single-region dependency as demand for already scarce viral vectors surged owing to vaccine production and the growth of gene therapies, leading to major bottlenecks in manufacturing. To address vulnerabilities, companies need to strategically deploy multisourcing, including from lower-cost countries, while balancing risk reduction with the higher costs of lower purchase volumes per supplier.
Go to Market
Leading biopharma companies spend an average of about 20% of their revenue on sales and marketing, which is a lot when you consider that, in theory, matching the right patient with the right treatment at the right time should require very little marketing or sales effort. However, the traditional biopharma commercialization paradigm has remained remarkably stable. While several additional levers (such as omnichannel marketing and patient finding) are for the most part now in play, none of the traditional cost drivers—including spending on commercial field forces, medical-science liaisons, and marketing, access, and medical teams—have significantly declined in relevance or gone away.
That said, companies do have options for containing their go-to-market expenses, which they can reduce by 5% to 30% through a set of structural moves.
Optimize the market footprint. Biopharma companies have traditionally been keen to expand their organizational footprints in order to diversify revenue streams, secure a first-mover advantage, achieve economies of scale, and enable sequential product launches. Their default approach has been to establish a presence—and give patients access to their medicines—in countries across the globe. In the coming years, though, companies will need to adopt a more disciplined approach to their footprint and reorganize their marketing, market access, and medical teams to serve it better. They can explore more partnerships with local players, look for innovative ways to set up local organizations, and revisit the common practice of retaining large, fixed-cost bases in smaller markets in preparation for the next wave of products (which may come late or never). In many instances, distributor and local partnership models are better suited for the management of tail-end portfolios of smaller, mature products.
Companies should also examine the interplay of roles and responsibilities across global, regional, and local commercial teams to reduce redundancies and better align with their footprint. Duplication is an issue at all levels, and decision making can be significantly slowed by cumbersome coordination and review cycles.
Companies should examine the interplay of roles and responsibilities across global, regional, and local commercial teams.
Reset the customer engagement model. Even before the pandemic, customer engagement was shifting from traditional models—in which sales representatives managed virtual interactions and field reps managed in-person visits—to hybrid and omnichannel models that blend digital outreach with targeted, in-person interaction. COVID-19 accelerated this process, and a blend of virtual and in-person interaction has proven more effective, tripling promotional response rates and expanding sales reach by up to 15%, according to recent market reports.
While these models require sizeable one-time investments in digital, data, and change management to cultivate a more data- and digitally savvy field force (and to improve collaboration between field and nonfield teams), the initial costs are offset by significant recurring savings, such as reductions in sales force and operational costs.
Reimagine product-based investments. When launching a new product, companies seek to maximize its impact with investments that help position it in the market and manage its life cycle. Too often, though, they open the marketing floodgates when instead they should take a more measured approach. Certain postmarketing activities (such as mandatory postmarketing commitments) are nonnegotiable, but others should be carefully assessed for their return on investment. For example, we regularly observe that large portions of medical-affairs spending (for example, on Phase IV studies, investor-initiated research, and publications) are not ramped down as products mature. This also applies to spending on advertising and promotion, where prescriber sensitivity is often overestimated.
General and Administrative Expenses
In addition to the G&A savings that result from adjusting the market footprint, the following levers have the potential to generate savings of 5% to 15% across G&A cost categories.
Rethink procurement. The procurement function can expand beyond its traditional role of controlling purchasing costs to form value-adding partnerships with suppliers. Take the example of clinical contract research organizations. Biopharma companies have been taking advantage of a “race to the bottom” in a largely undifferentiated pool of suppliers. As a result, these organizations are cash flow-constrained and hard-pressed to build new capabilities and improve service delivery, leading to quality issues and delays. This is a lose-lose situation for an industry in which time to market is a key driver of success.
Biopharma companies should take a closer look at demand management and leverage their supply bases as strategic partners; together, they can fully leverage suppliers’ knowledge and capabilities and explore opportunities to accelerate supplier-enabled innovations. This requires stronger integration of procurement and contracting teams, as well as the cross-functional teams responsible for business outcomes. If those teams engage with suppliers in the search for win-win solutions, the result can be better service and lower costs, rather than today’s zero-sum game.
Transform shared services. Shared services can drive substantial value through improved efficiency, quality, and scale in functions such as finance, procurement, HR, and IT. Central to value creation is a platform delivery model: a structured approach that organizes people, processes, and technology into a single, cohesive framework. This model connects business units and shared services through streamlined workflows and shared tools, reducing redundancy and delivering a seamless, user-friendly experience across functions.
Thinking through the best geographic location for service centers and global capabilities further enables this model. Companies can leverage offshoring and the use of automation and digital technologies as a major arbitrage opportunity for labor costs. After initial ramp-up, we have seen clients break even in one to one and a half years.
Build a world-class tech function. Tech functions are moving from the back office to become strategic partners for the business. To play this role well, they must continue to realize efficiencies and cost savings, so that they have the budget to invest in building new capabilities that enable value-adding activities.
Tech functions are moving from the back office to become strategic partners for the business.
We recommend that companies look beyond the low-hanging fruit of technology cost optimization (such as sourcing excellence) and pursue transformational opportunities between the tech function and the business. The single biggest opportunity is in the business–tech operating model, with a host of initiatives that include breaking down silos, reducing duplication, resetting the tech project portfolio, rationalizing the app and data landscapes, and simplifying reporting. Our experience suggests that many such initiatives can be realized within six months to two years, with the payback period varying from six months to three years.
Portfolio Rationalization
Portfolio complexity is a big cost driver in biopharma, underscoring the need for strong governance to balance innovation and diversification with cost efficiency. Most companies have opportunities to streamline and segment their product and portfolio mix. We see many clients pursuing the same modalities and disease areas, mainly because that’s where their peers are focused, even when they are not positioned to win in these areas. Because of the proliferation of “modality agnostic” R&D approaches, for example, it is now common for large biopharma companies to have as many as 11 different modalities in the pipeline. No company can win consistently across that wide a spread. Companies also overlook opportunities for SKU rationalization in the long tails of their smaller, mature, and often margin-diluting products.
This complexity adds up across the value chain, and its aggregate cost impact is often obscured. We recommend that companies assess the true cost of their R&D and product portfolios and consider steps for greater strategic focus.
Simplify the Organization
Most biopharma companies have complex organizations, with a dozen or more organizational layers encompassing global, regional, and local operations. In recent years, we have observed regional layers growing larger or more numerous at many companies, increasing the organizational distance between global teams and frontline markets. Most organizations still operate around traditional functional models and “waterfall”-type processes, which hinder cross-functional collaboration. Duplication of effort remains prolific as roles and responsibilities among layers and functions are not always clearly delineated. Most biopharma companies could benefit from zero-based organizational design, which would require them to define the critical resources needed to support growth drivers and build differentiated internal capabilities.
Maximize Technology Advantage
Companies that successfully combine human and technological capabilities generate about double the revenue growth of other companies, according to a 2023 BCG survey of 2,300 companies worldwide. Technology, telecom, and financial institutions are the most digitally advanced industries, with more than 30% achieving a high degree of human–tech collaboration. AI is a game-changer for these companies; generative AI, in particular, challenges traditional organizational models. For example, the most advanced companies do not look at GenAI as yet another tool to help humans but as a new team member that, with the appropriate input, training, and guidance, can outperform its human colleagues, even at Ph.D.-level tasks. Our models and A/B testing in the real world suggest the potential to free up 30% to 40% of capacity—and up to 90% in the case of some activities, such as medical writing. To facilitate AI integration and adoption at scale, we recommend pairing AI and GenAI capability-building efforts with moves to simplify the organization as described above.
The most advanced companies do not look at GenAI as yet another tool but as a new team member.
The biopharma industry has access to a wealth of research and clinical data, as well as decades-long experience with data management and data science (such as biostatistics). The analytical tools to support better designs and decisions already exist (these include AI-first drug discovery and AI-enabled patient recruitment in development), and some companies are beginning to use them at scale. In many instances, however, plans and decisions are still shaped primarily by the experience and judgment of individuals and teams, rather than by the full suite of available data and analytics.
Companies underestimate the change management challenge of integrating new technology into processes and workflows, and many efforts don’t progress past the pilot stages of deployment. The disconnect between the status quo and what is possible is wider in biopharma than in other industries. For the companies that move quickly, adoption of data, digital technology, and AI at scale will be a game-changer that both increases productivity and reduces costs.
Achieving Sustained Cost Advantage
Realizing sustained cost advantage requires a shift in mindset and a willingness to fundamentally transform the organization, including capabilities, processes and systems, roles and responsibilities, governance, and decision making. Companies that shy away from challenging the status quo won’t get beyond incremental savings that will likely dissipate within a few years.
Setting ambitious targets is critical to achieving bold changes. Taking a zero-based approach helps to develop solutions that are unconstrained by legacy ways of working and that incorporate lessons from other industries.
We have seen the greatest success when cost transformation efforts are set up as CEO-backed, enterprise-wide programs with full involvement of both the current leadership team and the next generation of leaders (who have a strong incentive to shape the company of their future). Among other benefits, comprehensive programs that are owned by the C-suite are most likely to surface critical interdependencies and tradeoffs.
Central program funding is critical to driving transformative initiatives with the appropriate pace and rigor, without affecting the ongoing business. A program management office helps drive effective execution and make sure value is captured.
It is essential to design a program that is time-bound with clear milestones (at the 8- to 10-week, 6- to 9-month, 12- to 18-month, and 24- to 36-month marks, for example). At the 8- to 10-week mark, the direction of the program should be clear, including the enterprise-wide savings ambition and the expected contribution by function. Most structural changes to the operating model and organization should be implemented by the 6- to 9-month mark. After 12 to 18 months, we expect to see 60% or more of planned savings realized. The program should be completed, with 100% of the value captured, after two to three years.
Leading biopharma companies will differentiate themselves by how they respond to the looming margin squeeze. Those that continue with business as usual will find their financial capabilities diminished, with adverse consequences for patients and shareholders. Those that develop and exercise their cost control muscle will get stronger and develop new sources of competitive advantage. These companies will be the winners in the coming years.