


Executive Summary
To understand why we have reached this situation and how to address it, we must look at both the huge upcoming wave of capital investment (demand) and the inefficiencies/bottlenecks in supply.
Based on the existing pipeline of announced projects we forecast that:
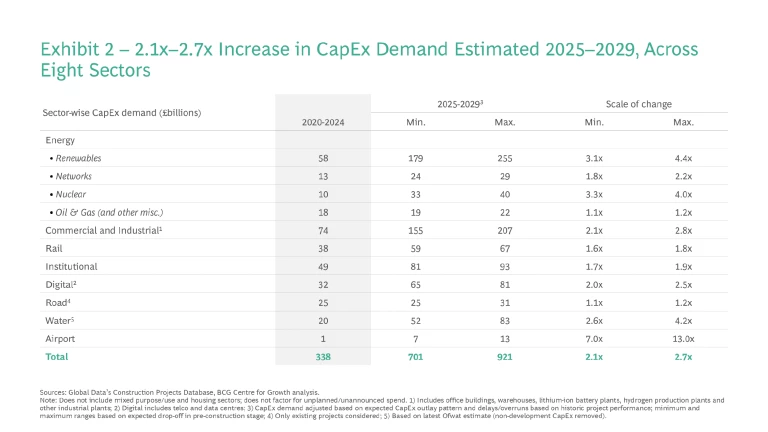
- Between £700 billion and £900 billion is currently planned to be spent on capital investment in the UK from 2025 up to 2030 across eight key sectors. This is between 2.1x and 2.7x the amount spent between 2020-2025 – a huge and rapid uplift.
- Some sectors see higher uplifts than others – renewable energy, nuclear and water sectors could all see 4x capital investment over the next five years compared to the past five years.
- Certain regions will also see significant overlaps of large projects. The East of England, London and northern Scotland will see significant capital investment due to Sizewell C, HS2 and offshore wind respectively. This brings benefits but also very real challenges, particularly in sourcing the right skills in some remote locations.
- Announcing new projects is the easy part – based on historical data from 2010 to 2015 we estimate that 16% of announced projects did not, in the end, proceed – while a further 21% have become stuck in the pre-construction period for over a decade.
- Scarcity of key inputs across both skills and key components.
- Lack of coordination and leadership both at national level and within supply chains: there is no clear pipeline or prioritisation at the national level, while there is too little leadership within our very fragmented supply chains.
- The move to a seller’s market: suppliers increasingly face the choice of which clients they work with. This means they accept less risk and make choices based on factors beyond purely price.
- Poorly scoped projects: at both a national and project level there has often not been proper scope optimisation and focus on what is really needed.
- Lack of effective and integrated commercial strategy: various stages of the delivery process are too disconnected.
This is not an unfamiliar story so far. But we see three key reasons why this time is different.
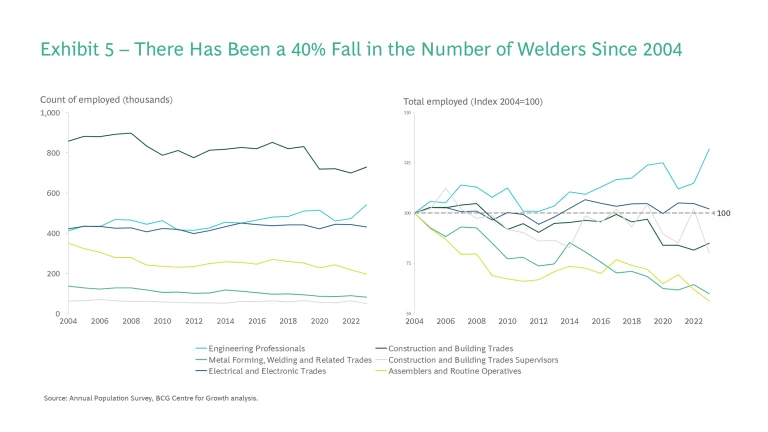
- Capability: there are both acute and chronic skills shortages. For example, the number of welders employed in the UK has fallen by 40% in the past 20 years. For the upgrade of the electricity grid, lineworkers are an acute shortage – based on training requirements it is not physically possible to expand the numbers in the UK to the level needed in the time available.
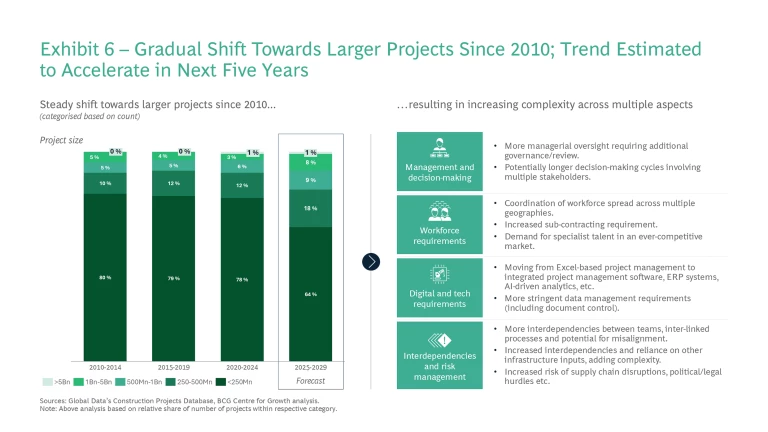
- Complexity: many of the projects in the pipeline are complex and/or novel. Scale also adds complexity; since 2010 80% of projects have been smaller than £250 million. For the next five years that is expected to drop to 64%.
- Capacity: many of these sectors’ supply chains overlap, meaning they source from the same companies for skills and components. The UK has not seen such a large uplift across so many sectors for almost 75 years. But even that period doesn’t compare for some sectors. For example, the level of electricity network capex in the UK rose by ~3.5x from 1950 to 1965; we estimate that the level of capital investment in the electricity grid will rise ~7x from 2015 to 2030.
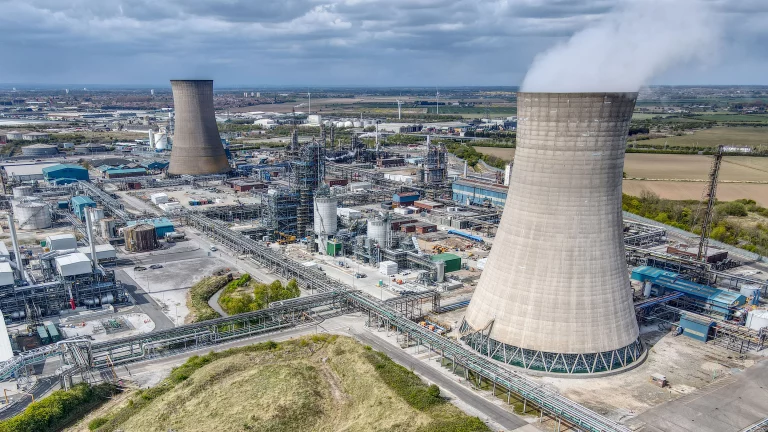
Raising investment, particularly capital investment, is regularly put at the top of the list of things the UK must do urgently if it wants to increase economic growth and prosperity. With good reason, too: the UK has historically underinvested compared to peers and has a lower level of capital stock per capita than other European countries. This push for economic growth is also layered on top of two other important trends which will require a significant uplift in investment. First, the energy transition will require an overhaul of the entire energy system from generation to distribution. Second, the historic lack of investment across the UK means that much of our capital stock is now outdated, insufficient or simply not functioning. From water to hospitals, there must be a broad programme of national renewal. In many ways, this moment presents a significant opportunity for the UK to do things differently.
Together, it is hoped and expected that these trends will be the impetus for a wave of new investment.
There is, rightly, much focus on how this will be financed and whether our planning system can be reformed to avoid it stopping this wave of investment before it even gets going. We should not underplay how important the reforms to our planning system are, and the UK government has already taken some positive steps here. But too few people have asked whether our supply chains can actually deliver this investment.
For many key sectors of the economy, this is a crucial question. The answer, as it stands, is that they cannot.
Last year we detailed extensively the major problems facing the delivery of infrastructure projects in the UK. One of the key issues we identified is the fact that, over the years, UK supply chains and skillsets have degraded due to a lack of clarity on the pipeline of projects, inconsistent priorities and wild swings from feast to famine in terms of investment. This has resulted in fragmented supply chains made up of a large number of small firms, which suffer from low productivity, significant inefficiency and slow delivery times. This was echoed by the National Infrastructure Commission in their recent report which has labelled the UK’s ‘constrained supply chain’ as one of their four key drivers of higher cost in the delivery of infrastructure projects.
All of this means that even if the UK does succeed in unleashing a wave of investment, due to the degradation of our supply chains the likelihood is that there will be a significant mismatch between demand and supply resulting in bottlenecks, sharp cost inflation and many delays.
Why Won’t Market Forces Solve This Problem for Us?
We see three key reasons why market forces alone won’t solve this:
- Lack of price signals from consumers: The textbook logic, to some extent at least, relies on clear price signals from consumers (or more broadly the underlying demand) to be passed through to the supply chain. However, this doesn’t always work in heavily regulated sectors. Take water for instance. Ofwat sets “the price, investment and service package that customers receive. This includes setting controls that limit what companies can charge their customers”. While this tries to account for investment plans, it cannot fully account for unforeseen inflation and bottlenecks. The limitations on what consumers pay for water mean that the relative importance of it may not be fully reflected in the price, and therefore supply is unlikely to respond as hoped. This is because the clients who will be able to pay suppliers most will not necessarily accurately reflect consumer demand, scarcity or necessity.
- Prioritising through scarcity may not lead to optimal national outcomes: As it stands projects are prioritised through scarcity. However, given the UK will have multiple sectors competing for scarce resource, it is not guaranteed that those sectors willing to pay the most or offer suppliers the most advantageous terms will be those that should be prioritised from a national perspective. This is further exacerbated by the lack of clear price signals mentioned above. It is also not just a case of competition within one sector of the economy, but across multiple, many of which underpin vital economic and public services.
- Regulatory constraints: Alongside the well documented planning constraints, there are two others which are particularly relevant.
a) Immigration system. The limitations around the level and type of immigration means that there are very real constraints on the ability to resource the necessary workers and skills. This is particularly true for site workers whose wages may not meet the levels needed under the current visa schemes. More broadly, the Skilled Worker Visa system does not seem well suited to the construction sector given that 30% of construction workers are self-employed (compared to an 11% average in other sectors), yet it is near-impossible for self-employed people to acquire a Skilled Worker Visa.
b) Fiscal rules. The fiscal rules mean there are also clear constraints on the level of capital investment which the public sector can make. While much funding may be driven by the private sector, in many cases the public sector is the ultimate client and some element of public funding is often crucial.
Stay ahead with BCG insights on urban planning
Section 1 - The Coming Wave
The first step in understanding the challenges our supply chains face, and the potential for a significant demand/supply mismatch, is to recognise the scale of the investment uplift currently proposed in the UK. Leveraging Global Data’s Construction Projects Database as well as publicly available sources such as the IPA Pipeline, NIC and NESO forecasts we have identified over 1,600 large capital or infrastructure projects currently announced, planned or underway over the next five years across eight capital-intensive sectors in the UK.
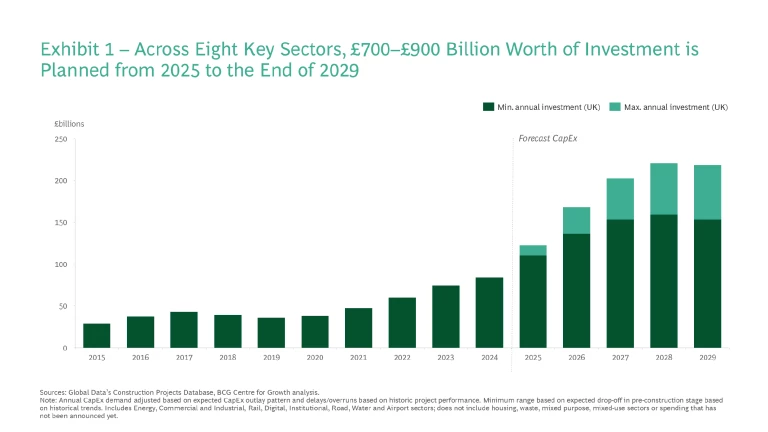
Exhibits 1 and 2 set out the currently expected uplift in capital investment over the next five years compared to the past five years. The average investment uplift across these sectors is 2.1x to 2.7x with the total amount of investment (both public and private) expected to be between £700 billion and £900 billion in the next five years.
We estimate a range in the size of the uplift; this is to account for the fact that some of the announced projects will never be completed or may not even get off the ground. We looked at historical data from 2010 to 2015 to assess the average number of projects which get stuck at early stages of development or are scrapped after being announced. We estimate this drop-off rate to be 37%, with 16% of projects announced eventually being scrapped and a further 21% getting stuck in the pre-construction phase for over a decade. Many projects will also be delayed during delivery: as we demonstrated in our work last year the average time overrun for infrastructure projects in the UK is 35%. Similarly, costs will often overrun original estimates (the average cost overrun for infrastructure projects in the UK is 57%). We incorporate sector-specific time and cost overruns into our dataset to account for both these outcomes.
For some sectors the uplift is much more significant – for example, the water sector could see up to a 4.2x uplift in investment. This is largely down to the fact that the UK has not built a new reservoir for 30 years (meaning previous investment has been too low) and the regulator has set a very ambitious asset management plan.
Furthermore, our figures may well be an underestimate of total investment spending in these sectors. Our dataset is focused on developmental capital investment – i.e., growth capital investment in expanding old assets or developing new ones rather than investment in maintaining existing assets. There is a significant amount on top of our figures likely to be spent on maintenance.
There are also projects which will take place that are yet to be announced. The recent announcement of support for the third runway at Heathrow and other airport expansions is a good example of this. We have incorporated these at a high level into our dataset based on previous estimates. But, of course, the actual cost and time to deliver these projects is very uncertain and will depend on specific design choices (amongst many other things) which are yet to be made.
Even projects which do not go ahead or progress past the planning stages can impact supply chains. These projects will still compete for funding and skills – particularly design, planning and project management skills which are most relevant at the early stages of a project and still in short supply.
As our dataset shows, the capital investment uplift is common across most of these sectors. This is important. The eight sectors we look at are all capital-intensive sectors which share some key overlaps. Specifically, they tend to source skills, materials, components and suppliers from similar pools. This makes the supply chain challenge even more acute.
It is also worth noting that our data helps to highlight an inherent mismatch in the market which supply chains constantly have to grapple with. Supply is slow and takes a long time to turn around. Whereas demand often remains uncertain for a long period and suddenly crystallises. This mismatch is an ongoing challenge but seems to be particularly relevant now, given there are several drivers (e.g., energy transition, planning reform) crystallising a large amount of demand coming to the market, while supply chains have lacked time to respond.
Lessons From Supply Chain Constraints During COVID-19
Looking at the US economy in 2021-22 is a good example of this. The economy reopened and, combined with significant monetary and fiscal stimulus, unleashed a new wave of consumer demand, particularly for durable and/or finished goods. This put major pressure on supply chains. The result, as we know, was significant inflation. A 2023 NBER study by Comin et al found that half of the increase in consumer price inflation seen during this period was down to supply chain constraints. Research from the Federal Reserve Bank of San Francisco put 60% of inflation in this period down to supply chain constraints. For specific materials and components inflation was significantly higher; lumber is a prime example. The price rose from $416 per thousand feet of lumber board at the start of 2020 to $1,670 in May 2021 – a 300% increase.
Similarly, in terms of components, the semiconductor shortage is well documented and down to a significant rise in demand in the face of a very constrained supply chain. This led to price increases and long delays in both the delivery of semiconductors but also the consumer products that relied on them, such as new cars. Notably, part of the story here was the fact that demand was coming from multiple different sectors all in need of semiconductors such as automotive, consumer electronics, energy (solar panels and turbines) and telecoms to name but a few.
There was also a similar story seen in the infrastructure sector. The Bipartisan Infrastructure Law enacted in November 2021 allocated $350 billion towards building bridges and highways over five years. However, the surge in demand combined with supply bottlenecks led to a rapid rise in inflation for key inputs such as asphalt, concrete and skilled labour. The net effect was that infrastructure spending fell in real terms in the short term and, while it is picking up now, there have been delays in developing the infrastructure base.
One sector that we do not include in our core list above is housing, as it has somewhat separate and more dedicated supply chains. It is therefore less likely to be fishing in the same pools for resource as the other sectors we mention above. That does not mean that it is not relevant for our analysis, however. It is another clear example of a capital-intensive sector which is expected to see a huge investment uplift, not least due to the government’s target to build 1.5 million new houses over the next five years. This is a 50% increase on the past five years. More importantly though, this increase is likely to have knock-on effects on the sectors we are looking at, specifically by increasing demand. More housing, particularly if in previously undeveloped or underdeveloped areas, will also increase demand for infrastructure such as roads, electricity, water, gas, sewage and digital. This has not yet been fully factored into the pipeline of spend, since the housing projects are themselves still very uncertain.
This leads on to another important point to consider when looking at the significant uplift in demand: the regional or spatial lens. We can also look at our dataset from a geographical perspective, to identify not just what the demand uplift will be, but where it will be. Whereas the government seeks to understand how to coordinate projects within a spatial plan to maximise growth, our analysis approaches it at a different but complementary angle—aiming to understand where activity is set to be highest, and therefore what coordination needs to take place in order to avoid specific bottlenecks. It is important that any spatial plans consider not just where the UK wants and needs certain infrastructure to be built, but how this can be delivered most effectively. For example, we need to consider the interactions between projects in close proximity; utilities may need to be moved for a new rail line but could also be being upgraded at the same time, creating complexity.
Exhibit 3 below shows the concentration of capital investment over the next five years by region of the UK. There are immediately some clear hotspots where multiple large capital investments are set to overlap. In the East of England, almost £70 billion is due to be spent on capital projects across Suffolk, Hertfordshire, Norfolk, Cambridgeshire and Essex in the next five years. This is largely down to Sizewell C, Bradwell B (a proposed small nuclear power station) and the construction of offshore wind farms on the Norfolk coast. Somerset also stands out for a similar reason; spend on Hinkley Point C is set to accelerate as it reaches a peak phase of construction. Somewhat surprisingly, parts of Central London are set to see a significant amount of activity (£46 billion in spend), driven in large parts by HS2, and the construction of ‘The Diamond’ which is set to be the third-tallest skyscraper in London. Finally, northern Scotland is also set to see significant capital investment with £43 billion attached to Aberdeenshire and £19 billion to the Highlands, although the bulk of this is actually off the coast in the form of offshore wind power, with much of the rest on the connections needed to the grid.
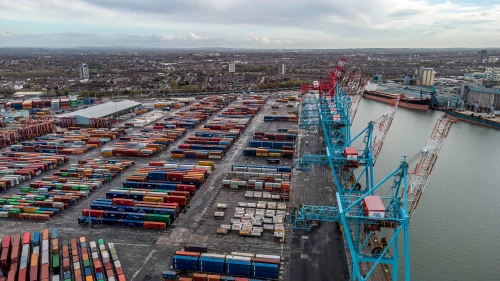
Stepping back, it is quickly apparent that many of these areas are quite remote and sourcing the necessary skills on sites will be a challenge. Similarly, transporting significant raw materials and large components can also be challenging (as we’ve already seen with Hinkley Point C). This can be due to a lack of sufficient infrastructure (road or rail which can accommodate large freight) and/or the lack of local production of some inputs which are often locally sourced (e.g., cement). This all suggests that there will also be regional as well as sectoral hotspots in demand, taking the form of large ramp-ups in capital investment. Of course, this is very much a positive thing, it can bring benefits in the form of employment and wider economic spillovers. But if not handled properly it could lead to inflation and put strain on local infrastructure.

Section 2 – Identifying Key Bottlenecks and Inefficiencies in UK Supply Chains
Our data gives us a good sense of the significant increase in demand the UK is expecting over the next few years. But it alone cannot tell us the key reasons why UK supply chains are unlikely to be able to meet this demand and what needs to be done to help ensure the UK seizes the opportunity in front of it.
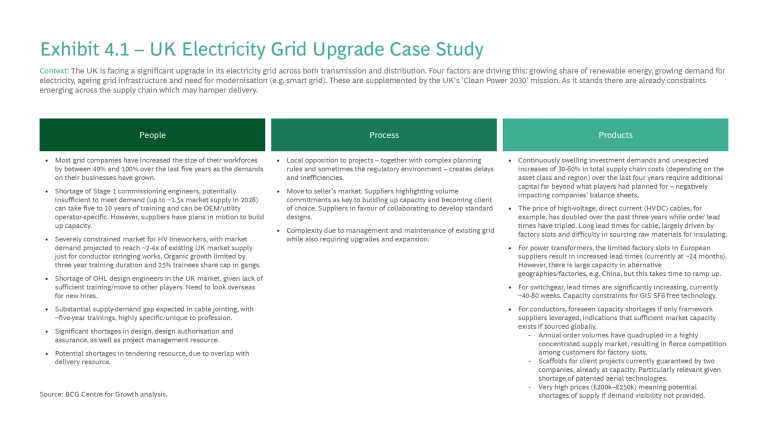
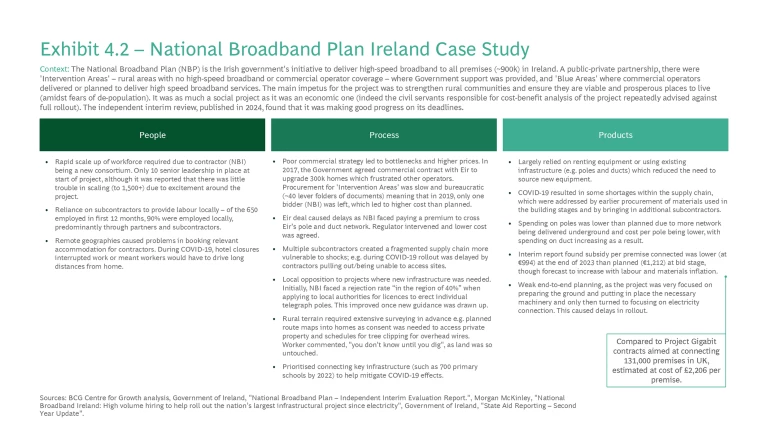
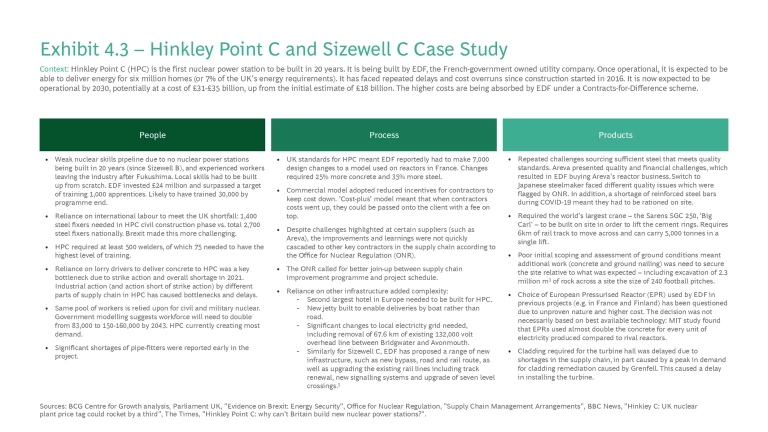
To fully understand these, we analysed three case studies across three different sectors (energy grid, nuclear and digital) as a representative sample of our eight sectors, using a framework for supply chain inputs around people, process and products. The framework provides a standardised way to assess the key inputs for each project, allowing us to identify bottlenecks, inefficiencies and shortages that occurred within the project. To develop the case studies, we interviewed experts and conducted desktop research using publicly available sources. All information used is in the public domain.
Exhibits 4.1, 4.2 and 4.3 below show our three case studies: the UK’s upgrade to its electricity grid, the rollout of broadband across Ireland and the construction of two new nuclear power plants in the UK (Hinkley Point C and Sizewell C). All of these are important and worthwhile projects. We have chosen them precisely because they are projects which, in our view, were important to pursue and which deliver net positive impacts. However, all display challenges at different points in their supply chains, as well as many positives. The case studies are designed to draw out key learnings and lessons.
Combined with learnings from our previous infrastructure work and our interviews with experts across the industry, we can identify five common bottlenecks or inefficiencies we see across UK supply chains:
1. Scarcity of key inputs, including due to international competition: this applies to both skills and key components, though they can have different drivers. Often this is exacerbated by different sectors competing for the same resources.
- Skills: most sectors see an element of acute skills shortages. This applies across the delivery process, not just during the construction phase. It isn’t just about construction workers but also shortages of professional services at the design and planning stages, both of which require specific expertise. For example, when setting up an organisation to run a large complex project (e.g. HS1) there is a choice of whether to make this a ‘thin’ organisation (light touch; mainly there to coordinate) or a ‘thick’ one (much more hands on in terms of delivery). As it stands, often these organisations are forced to be ‘thin’ by default since they cannot source the right skills. Often, even a small number of workers with a very specific set of in-demand skills (e.g., commissioning engineers) can hold up very large projects. There is also often a regional element to these shortages, where it can be hard to source certain skills in more remote locations or where multiple large projects are happening at the same time.
- Components: the UK is seeing significant backlogs and/or price increases for certain components, often driven by international demand and competition.
2. Lack of coordination and leadership both at national level and within supply chains: in the UK there is little strategic prioritisation of projects at national level. This means that resources are allocated purely by scarcity which may lead to suboptimal outcomes and inefficiency in how resources are allocated. Similarly, but separately, there can be too little leadership by clients across their supply chains (which are often very fragmented). Tier 2 and 3 suppliers might not be given sufficient direction or a Tier 1 supplier might not have good visibility of what is going on in their supply chain. Either way, this can create inefficiencies and bottlenecks, particularly for larger projects with complex supply chains, at least partly because it delays decision making (delays which then get amplified later in the project due to the knock-on effect).
3. Move to a seller’s market: given the huge level of demand (both nationally and regionally in Europe) many suppliers are in the position to pick and choose which clients they work with. Often, they make this choice not purely on price but also on nature of contracting, pipeline of work and the clarity on whether a project will actually proceed as planned. Furthermore, given their market power, the level of risk which suppliers are willing to accept is going down. They will transfer this back to the client or Tier 1 supplier. This in turn further hampers the allocation of resources within the supply chain.
4. Poorly scoped projects: at both a national and project level there has often not been proper scope optimisation or focus on what is really needed. This leads to too much demand and poorly allocated supply. Often it starts at the earliest stage, with projects having too many objectives and a poorly tailored business/economic case.
5. Lack of effective and integrated commercial strategy: various stages of the delivery process are too disconnected; for example, where the delivery model is not tied in with the contracting approach. This disconnect can also apply across projects where potential for overlaps and co-location are missed as they are run on completely different procurement processes. This often means the right incentives around delivery are not created but can also mean inefficiencies creeping into the supply chain as opportunities for efficiency improvements are missed.
There is a common thread to these key themes: the siloed nature of decision making. We can see that at a national or strategic level there is too little consideration given to how different sectors’ demand and supply might interact (or how international demand might impact planning). Similarly, within sectors or supply chains there is too little thought given to how the contracting approach interacts with the delivery model or how the different stages of a project might be bundled from a skills or geographical perspective. Together this means a lack of planning, clarity and a rise in inefficiency within supply chains.
Section 3 – Why This Time Is Different
Taking all this together, it is clear that if the UK has any hope of achieving its goals there is likely to be a significant uplift in investment (demand) over the coming years. Due to their siloed decision-making, supply chains in the UK are unlikely to be particularly responsive to this, especially in the short term.
Of course, to many in the industry this might have felt like a familiar story so far, albeit with some higher numbers. The issue of supply constraints is often discussed, if rarely fully detailed, while a spike in demand is often rumoured or predicted but fails to materialise, usually due to planning and/or political bottlenecks. Given this, it is important to distil why we feel this time is different. We see three key reasons, all of which overlap and interrelate to mean the upcoming demand/supply mismatch is likely to be one we have not seen in the UK before.
1. Capability
As our case studies above illustrate, there is likely to be a fundamental shortage of certain skills and components within UK supply chains. This raises the question of whether there are the fundamental capabilities necessary to deliver the scale of investment required.
While this is not necessarily a new problem, this time is likely to see a combination of both chronic and acute skills shortages.
The chronic shortages have occurred due to the long-term decline of certain key skilled trades and the broader lack of investment into skills and training across the sector (in turn, down to the lack of a clear and consistent pipeline of work). This can be seen at a high level by the fact that number of construction workers employed has fallen by 15% over the past 15 years. The number of people working in the industry as a share of overall employment has reached the lowest level since 1970 (when records began). For a more detailed example we need look no further than the long-term decline in welders and related trades in the UK. As Exhibit 5 below shows, over the past 20 years, the number of welders and related traders employed in the UK has fallen by 40%. This is also true of assemblers and related routine operators. Welders in particular are going to be crucial for much, if not all, modern infrastructure construction. According to data from the Department of Education, out of the top 15 job vacancies which are most difficult to fill due to skills shortages, four are in the construction industry, more than any other single sector.
In many cases the shortages will be sector-specific and possibly quite short term in nature. The case of high voltage lineworkers for the electricity grid is a perfect example of this. Fundamentally, it looks impossible to train the necessary numbers needed over the next five years. Furthermore, even if they are trained here, it is not guaranteed they will be deployed here given these workers are often needed on projects across Europe. This is an acute challenge at a key point in time for the grid. There are several steps which could be taken to address both demand and supply. For example, regarding supply, the working season could be expanded (weather permitting), the training required reduced from three to two years or the number of trainees allowed on teams increased from 25% to 35%. Of course, safety must be kept in mind for all such adjustments. But even with such adjustments it is unlikely the number of high voltage lineworkers needed will be reached before 2030. This suggests the gap would have to be sourced from abroad. However, so far, many firms report issues getting work permits approved for lineworkers from parts of Europe. Furthermore, immigration issues notwithstanding, similar grid upgrades are taking place all over Europe with Germany, Italy, Spain and Portugal all facing similar skills shortages and therefore already competing to find these workers.
Another factor impacting the capabilities of supply chains in the UK is the reduction in the number of large Tier 1 suppliers (also known as the general contractor, these are usually large firms responsible for the delivery of the bulk of a project or at least a large defined workstream) and the increasing reliance on a wide variety of smaller Tier 2 and 3 suppliers to deliver even large projects. Over the past few years several Tier 1 suppliers have folded, such as Carillion and ISG. The low level of returns, high level of risk and high barriers to entry in the sector has also deterred new entrants. Within the construction industry the number of workers employed by firms who employ 24 people or fewer has risen from 50% of construction employees in 1997 to 60% in 2023.
2. Complexity
So far, we have focused on the size of the uplift in investment. But there is another important factor which also suggests that this time will be different: complexity and novelty. In many cases the projects being undertaken are of a higher order of complexity than the UK has usually seen and/or are subject to some sort of novel requirements which have never been implemented in large capital projects in the UK previously. This is because, in many cases, the UK is rolling out relatively new technologies (for example as part of the energy transition) and/or it has adopted new regulatory frameworks (for example around sustainability) which have not previously been utilised. Often, there is also too little use of standardisation or repeatability.
Broadly, this complexity and novelty spans four key types: technical, regulatory, political and economic. Political complexity is well documented. This is in part down to the complex planning and approval process. It is also in part down to uncertainty introduced by the political process, which may be due to the desire to push ahead with projects before they are ready (which in the end adds cost and time), or the fact that large capital projects often run for many years over multiple political cycles, raising questions about enduring support. Similarly, economic complexity is fairly well discussed and focuses around the potential for macroeconomic uncertainty to impact supply chains. We saw a perfect example of this during the COVID-19 pandemic and the aftermath where bottlenecks and shortages caused projects to be delayed or costs to increase. Given these types of complexity and novelty are well documented we will focus on the technical and regulatory forms. Looking at specific examples is helpful here.
The development of small modular nuclear reactors (SMR) is a good example of the regulatory complexity we have in mind here. These represent mature technologies since they build on the established approaches of larger nuclear power stations and the small reactors in nuclear submarines. They are also expected to involve lower risk levels than larger plants, not least due to the lower pressures and stresses involved, as well as the fact they can be more easily and cost-effectively isolated in the event of any issues. However, fundamentally they still need to meet the same regulatory and certification requirements as a full large-scale nuclear reactor. This adds complexity, inefficiencies and delays as we potentially see a regulatory regime which is not well suited to the technologies in question. Furthermore, we still see similar technologies having to complete separate Generic Design Assessments (a pre-licensing process that evaluates the safety, security, and environmental acceptability of a nuclear reactor design) to vet their approaches. That said, to the credit of the nuclear regulators in the UK they have taken steps to address this. They have sought to streamline GDAs where possible for SMRs. For example, step 1 of the GDA for Holtec’s SMR-300 reactor was completed in record time and 65% faster than any previous GDA at this stage.
The water sector is also seeing novel requirements evolve due to regulation, specifically around climate adaptation and resilience. This has led to an emphasis on nature-based solutions from the Department for Environment, Food and Rural Affairs (Defra) and Ofwat.
The offshore wind sector is a good example of unexpected technical complexity. In 2000, turbines installed in the UK had a rotor diameter of 66 metres. By 2020 Siemens Gamesa Renewable Energy (SGRE) announced that turbines for its UK offshore wind farm would have a rotor diameter of 222 metres – a 236% increase (or a 16x increase in Blade Area Ratio). Globally, the average turbine power capacity, closely correlated to turbine size, increased by 800% between 2000 and 2023.
There is also a scale point here which is important to consider. It is well established that larger projects are inherently more complex to deliver. As we noted in our work last year, the UK has a penchant for megaprojects, often pursuing large and complex projects which could potentially be more effectively delivered in smaller chunks. The size of the supply chains involved as well as the multitude of interactions, for example with other utilities, mean that these sorts of large megaprojects see complexity rise exponentially. The large lead contracts can also obscure bottlenecks further down the supply chain, for example by contracting with firms that lack the scale to deliver such a large contract. As Exhibit 6 below highlights, this is not expected to change with the coming wave of investment; indeed, it may even get worse. Since 2010, roughly 80% of projects have had a project value of £250m or less. However, in the next five years that is expected to drop to 64%.
This scale challenge also adds interdependencies, creating further complexity. For example, building a large nuclear power station over many decades requires also providing road and rail infrastructure, which themselves require lengthy planning approvals and face several supply chain challenges. Similarly, if a project has large power demands it could require new grid connections, which currently takes an average of five years.
The final element adding complexity is the fact that almost all new infrastructure or large capital assets will have significant digital elements. This is a novel challenge/requirement. It also tends to be quite end-to-end: new sensors are required, devices need to be ‘connected’, networks need to be linked, data integrated and platforms created to manage it all. Systems integration is regularly a major bottleneck in large infrastructure projects. For example, from a construction perspective the Elizabeth Line was actually largely built by 2017 (tunnelling completed in 2015, all core track work completed by mid-2017 and the project overall 75% complete in mid-2016)
3. Capacity
The capability and complexity issues are likely to present largely at a sectoral level. But as we have noted above, there is a broader issue at play here too. This is not the case of an investment uplift happening in just one or two sectors but across eight key economic sectors. Furthermore, many of these sectors are interrelated and look for skills, components and materials in the same supply chains.
Competition is therefore now taking place at three levels. First, it exists internationally between the UK and other markets. Many of the skills and components needed for these large capital projects are allocated by global markets and firms. Second, it is seen between different sectors as they compete for overlapping requirements and inputs. In the past the ability for workers to move between sectors has been beneficial. For example, the Thames Tideway Tunnel project benefitted considerably from construction of the Elizabeth Line coming to an end as its construction commenced, meaning there were large numbers of experienced workers, particularly tunnellers, who could easily transfer across given the similar skillsets required.
Given this, the UK is likely to see a very real capacity challenge. There are supply chains that are already struggling at a sectoral level and then seeing their challenges exacerbated by the fact that they are trying to serve many sectors at once.
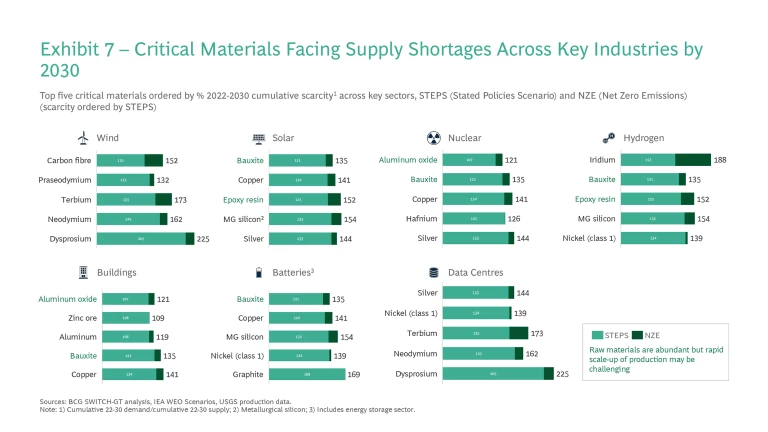
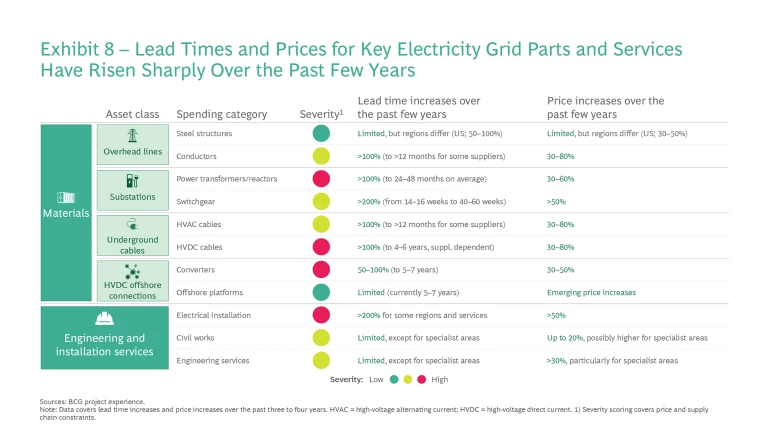
To highlight this, we have leveraged BCG’s supply chain mapping tool Switch GT. Exhibit 7 shows that at a global level, cumulative demand is set to significantly outstrip cumulative supply for certain materials up to 2030. It also highlights that some materials, such as bauxite, are common across several sectors, which means the impact could be amplified. UK supply chains will be sourcing these materials within the global market and will be competing for scarce resources. The UK alone is unlikely to be large enough to create scarcity, but many of these materials are already scarce. This is likely to lead to cost increases and delays. Furthermore, this is not only true for materials but also key components. Indeed, this has already begun in the electricity grid space. Exhibit 8 below, drawn from a wider piece of BCG analysis on the challenge of overhauling transmission grids as part of the energy transition, highlights the breadth of the bottlenecks and price rises seen at a global level for key grid components.
The other important reason why this time is different, from a capacity perspective, is that historically it has been very rare to see such a significant uplift in capital investment across so many sectors at once. To demonstrate this, we have looked at the expansion of capital stock/capacity across some of our key sectors since 1950. In Exhibit 9 below we plot the standard deviation in the growth of capacity in each sector over five-year periods compared to the mean annualised growth in capital stock between 1950 and 2020. This gives us a good proxy for the growth in capital stock and capacity of these sectors over different time periods compared to the average level of growth over the whole period. Essentially, a high score suggests a period is one in which there was an unusually fast ramp up in capital stock/capacity, while a negative score suggests that growth in capital stock/capacity was below the mean for the period 1950 to 2020 (not that growth was negative).
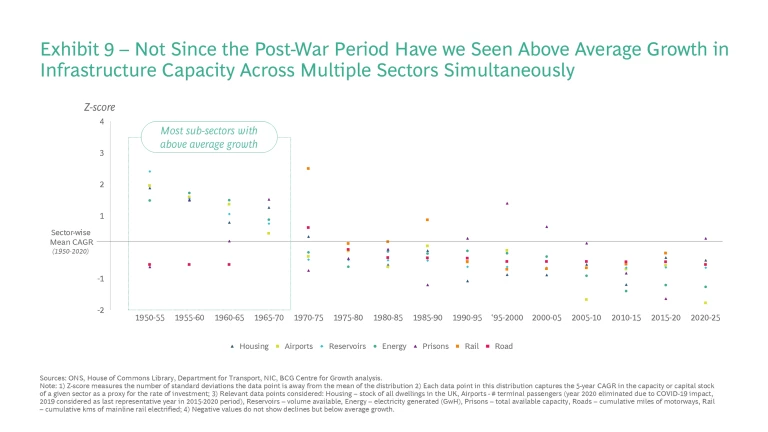
What we can see is that there was a significant building boom across multiple sectors in the post-war period up to 1970. Of course, the supply side of the economy was in a very different state then. For example, public sector net investment reached a peak of 7.5% of GDP in 1967/8 compared to 2.6% in 2023/4.
Furthermore, the speed of the uplift is likely to be quicker than we have seen before. The level of electricity network capex in the UK rose by ~3.5x from 1950 to 1965.
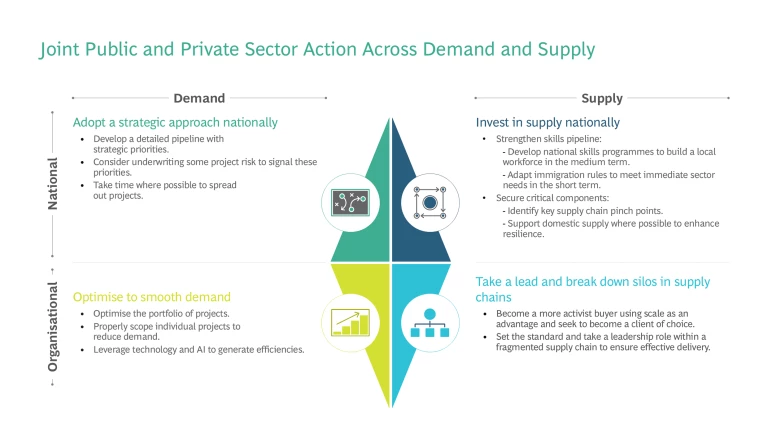
Section 4 – Joint Public and Private Sector Action Across Both Demand and Supply
Stepping back, it is important to remember that the issues we have outlined are ultimately a consequence of a major opportunity for the UK. The fact that so many capital investment projects have been announced and are progressing demonstrates that there is real momentum behind the desire to lift investment in the UK. We know that doing so has the potential to raise productivity and economic growth. Furthermore, the challenges we outline are not all insurmountable. Some are more global, such as materials and components shortages, and the UK is unlikely to solve them unilaterally. In other areas there are some potential solutions. However, this is not something the public or private sector can fix alone. They need to work together to smooth the coming wave of demand and to maximise our supply, both in terms of capacity and stability. They must also take a more strategic approach to sequencing and prioritisation rather than purely allowing that to take place through scarcity as happens now.
Fundamentally, if the UK wants to deliver sustained higher levels of capital investment over the longer term, there will need to be significantly more capacity built in the UK to underpin this. This capacity sits across both the public and private sector and has been neglected for decades in the UK.
Our recommendations below are not mutually exclusive; indeed, many are interlinked and work best if deployed in conjunction with each other.
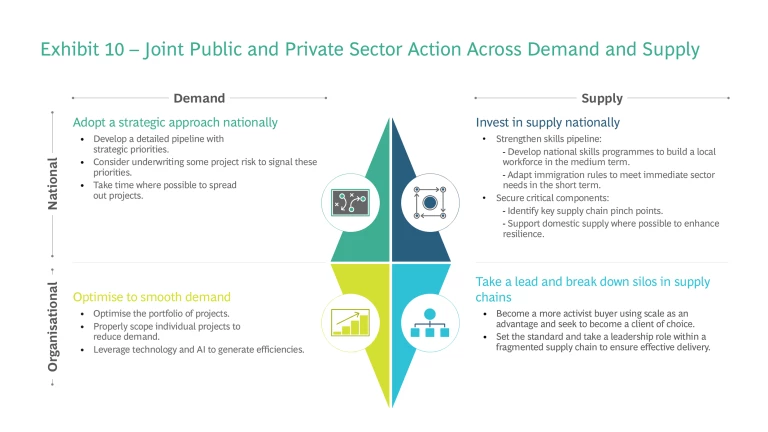
National – Demand: adopt a strategic approach
At the national level it is vital that a coherent and strategic approach is taken to smoothing demand. This is not about command and control. But where the UK has a combination of clear market failures and constraints alongside a series of ambitious targets on growth, energy transition and asset renewal it cannot be that the chips ‘just fall where they may.’ This is not an effective strategy for delivering on outcomes. Furthermore, there is a potential collective action problem: while organisations might well take the right decision for themselves at a micro level, when these individual actions are summed, there is no guarantee it will lead to the best outcomes for the country. As such, it is about giving as much clarity to the supply chain as possible and providing certainty around priorities, which in turn provides guidance around resource allocation. We see two key elements to this.
1. Develop a detailed pipeline with a clear sense of strategic priorities: We have previously emphasised the need for a detailed pipeline of infrastructure and large capital projects to give certainty and clarity to the supply chain. This will allow suppliers to invest and, in turn, to steadily expand supply. However, in the face of a large demand/supply mismatch, it must go further. There must also be some sense of prioritisation at the national level. As we have set out, there is no guarantee that the market will allocate resources to national priorities given the various market failures. The pipeline should include a portfolio view in that it should cover key sectors and all regions (to address the need for understanding around regional bottlenecks). Particularly where the public sector is the ultimate client, there should be a clear signal within this pipeline of what the priorities are, and when. There are several ways in which these priorities can be developed and signalled:
a) Leverage backstopping risk and providing guarantees to signal priorities: As we set out in our previous work, the public sector often seeks to pass all the risk onto the supply chain but regularly fails to do so since, fundamentally, some risks on very large projects will always sit with the public sector as the ultimate client. Here it makes sense to make that fact explicit and remove some of the political and wider tail risks from the project. This in turn will signal to investors and suppliers that this project is a priority. A good example of this is the Thames Tideway Tunnel project. The government provided a series of six contingent financial support contracts.
b) Take longer: This seems counterintuitive but as we have set out before, when it comes to large complex capital projects it is not as simple as time equals money. This is even more true when some prioritisation is needed. The pipeline should be properly vetted to understand what is truly urgent and what could be slowed down. This can help to spread and smooth demand. This is particularly important when considering regional pinch points and the need to stagger project delivery within regions. Furthermore, taking more time will allow for more mature designs, which will save time and money down the line. It also has the added advantage of supporting the need to more towards a steady and consistent pipeline which aids the building of capacity and keeping it in use, as opposed to the usual feast and famine approach the UK has taken.
c) Work backwards from a set level of supply: It can be useful in this process to flip the calculation on its head. Often the public sector will, logically, start from what it wants and needs (i.e., be demand-led). However, it is also important to consider what can realistically actually be achieved within a given timeframe (i.e., be supply-led). Given we know there are some very real constraints on supply, it is worthwhile to consider within a broad supply envelope what can realistically be delivered, and therefore how one would prioritise allocation of constrained resources.
2. Be a coherent client: As it stands, suppliers and contractors often report mixed messages from different parts of the public sector. For example, even if a supplier is not providing the necessary service quality on one contract, they may be spared pressure and repercussions as this could harm their ability to deliver on another public sector contract. This lack of cohesion creates some perverse incentives and often deprives parts of the public sector of the tools necessary to ensure the highest quality of delivery possible. Similarly, it is not clear who is ‘responsible’ within government for the construction sector outlook and strategy, to the extent there is one. Despite this being a vital underpinning for a variety of other sectors, there is no joined-up approach or thinking. To correct all of this, the new National Infrastructure and Service Transformation Authority (NISTA) should work to ensure coherence amongst various parts of the public sector (particularly different departments and regulators) and own a strategic view of the construction sector.
Organisation – Demand: Optimise
Setting national priorities is unlikely to be sufficient when it comes to smoothing demand. Indeed, the vast majority of levers are held at the organisational client level (both public and private). There are several best practices that clients in the industry should adopt to help manage demand. Many seem like common sense, but too often, especially on large complex projects, the basics are not done well. These actions are not only in the national interest but in organisations’ own interest too, since they help ensure the most efficient use of resources and reduce the chance of facing bottlenecks and inflation in their supply chain. We see three key actions which can help to optimise demand at an organisational level.
3. Portfolio optimisation: This will help to ensure supply chain resources are used most effectively and deployed or accessed in the right order. Broadly this requires a rigorous and quantitative approach to assessing your portfolio of projects, which in turn is reliant on developing deep understanding of both the client’s demand and the suppliers’ capabilities. There are two key elements to this:
a) Maximise resources for outcomes by identifying overlaps: By looking across not only the entire project but also across multiple projects, organisations can identify potential overlaps where resources can be deployed once rather than multiple times. For example, bringing together the installation of all utilities in one go for a project rather than returning in sequence to install utilities in the same location multiple times.
b) Recognise path dependencies: Again, by looking across an entire project delivery cycle, organisations can identify the critical path dependencies, i.e., which parts of the project need to be delivered for others to then be built on. Often, there are small parts which might not look critical in isolation but which can hold up the whole project. For example, during the Elizabeth Line project at Kensal Green, a new power transformer and tunnel was required to provide traction power for trains. At one point during the project it was suggested that it would take seven years for this transformer to establish a grid connection, which became a material risk to the entire project and a significant bottleneck on progress. This could have significantly delayed the entire project, since without it there would have been no traction power supply for the trains. Fortunately this was resolved, but it highlights how a single critical dependency can disrupt an entire delivery process.
4. Scope optimisation: A key part of demand smoothing is to do only what is necessary and focus on the minimum viable product. Of course, there are times where something more elaborate is needed – a gateway station for example – but, for the vast majority of projects, designs are far too often well beyond what is needed. Too often they are now designed to avoid any challenge rather than to achieve specific outcomes and/or to meet very extensive biodiversity targets rather than considering alternative ways to do so. By reducing superfluous work, demand can be reduced and supply focused on what is important. There are few steps which can help to optimise scope:
a) Work output backwards: As at the national level, organisations often do not start with a perspective on the capacity they have (or can access). Combining this with a sense of the key outputs or metrics that need to be achieved, it is possible to identify what is truly necessary and what can be cut.
b) Consider alternative approaches: This is good practice at the early stage of any large project. Can objectives and outcomes be achieved an alternative way? This may mean either in a macro sense (across the whole project) or in a micro sense (for a given project stage or choice are there better alternatives given supply constraints). For example, when it comes to overhead lines for the transmission grid, one option could be to consider a ‘fittings only refurbishment’ rather than full reconductoring, where possible. This could reduce the demand for highly skilled lineworkers who are in short supply.
c) Triage tasks to use limited highly skilled workforce most effectively: By breaking out some tasks, it is possible to ensure that the most in-demand workers or resources are only used exactly when and where needed. Again, turning to the electricity grid as an example, often tower erection and conductor stringing are performed by a single team. This requires a full team of highly skilled lineworkers. However, in reality it is actually only the conductor stringing which requires that specific skillset and training, while the tower erection could be completed by a different (and more widely available) set of workers. By splitting these tasks, it would be possible to increase the capacity of a given set of lineworkers.
5. Embrace technology, digitisation and AI: The potential benefits of digitisation within supply chains are well established. This has been taken to another level with the deployment of GenAI. At every stage of the delivery process, it is likely that technology and/or GenAI can help to improve efficiency and increase productivity. The focus here must be improving output per worker in the face of the significant uplift needed. So far, this has very much been an enabler for the sector rather than a replacement for any capabilities. But adoption also remains low for three reasons: skills shortages, integration challenges with legacy systems and lack of understanding on use cases. Below are a few (non-exhaustive) examples of steps that can help:
a) Procurement: With a huge increase in capital investment, firms are going to have to significantly boost what they go to the market to procure. Of course, again they cannot easily or quickly ramp up their procurement teams. The role of procurement teams has also changed and become more complex, meaning many firms already face skills shortages here. By leveraging a database of past tenders, GenAI tools can reduce tender processing times by 50%.
b) Design: The design stage can be one of the most time and resource intensive of the entire delivery process. GenAI can generate designs within set building code and other exogenous constraints. It can then quickly iterate designs and help to test a variety of options.
c) Scoping: Various aspects of scoping can be improved and/or accelerated. For example, identifying bottlenecks or vulnerabilities within the supply chain and finding alternative suppliers where needed, as well as ranking suppliers based on performance and risk. In the consumer goods space, Unilever and Walmart have already adopted GenAI tools to help identify alternative suppliers at short notice when needed.
d) Optimisation: This can take several forms but includes speeding up the assessment of options for portfolio optimisation and using reference class forecasting to get a more accurate cost estimate early on in the process. For example, project scheduling could be completed more quickly and accurately using AI algorithms to analyse historical company data, project requirements, and resource availability. GenAI tools could quickly develop multiple scheduling options and run what-if analyses to explore how changes in variables (e.g., number of cranes used) would affect timelines and costs, aspects of project management which typically need a large group of schedulers working in tandem with each other.
e) Real time data sharing and dashboards: Integrated platforms can bring together real-time data from across the supply chain, allowing rapid assessment of emerging problems so early action can be taken. For example, integrating real-time supplier and delivery data with project timelines can allow for predictive alerts to be sent when the schedules do not line up and the project looks off track. Best practice should also be to maintain a single location for data sharing, ideally a joint platform, which the main contractors and supply chain can access to ensure everyone is working from the same basis.
National – Supply: Invest and bring in the best
At a national level, once a portfolio view is developed there arises the need to identify where there are shortages in supply, and intervention could help to address these.
6. Start building up the skills base early. There are three key elements here:
a) Invest in skills locally: As set out, there are some skillsets and occupations that will be required for decades to come, and for which the UK currently does not have sufficient numbers of workers. In these cases, early intervention is required to build up the capacity within the UK to train workers for these roles, through new or strengthened adult skills and training programmes. Where these are most successful, they are able to provide sufficient incentives for new students across three areas. Nationally, there must be a clear pipeline of work to make the time investment in training worthwhile. Locally, there must be a tangible and inclusive eco-system that a potential new recruit could enter into (typically characterised by strong links between colleges and industry). Finally, at a project level, there must be an obvious employment opportunity to which the skills can lend themselves. A good example of this is the Centres of Excellence at Hinkley Point C which were able to surpass their target of hiring 1,000 apprentices ahead of schedule, through close cooperation with Bridgwater & Taunton College.
b) Upskill the existing workforce: Given the pipeline of projects, and the timescales associated, it will be impossible to recruit sufficient workers by relying on new entrants to the labour force alone, either due to the time required to train them or the level of expertise needed. There is therefore also a need to identify where existing skilled trades men or women can be up-skilled via add-ons to their existing qualifications and then backfilled by relatively less trained workers. For example, the Engineering Construction Industry Training Board (ECITB), the Global Wind Organisation (GWO) and the Offshore Renewable Energy (ORE) Catapult have launched a new cross-skilling programme to support worker transferability between oil & gas and wind operations and maintenance.
c) Identify the critical enablers: There will be a reasonably small number of critical skills without which a project may be significantly hindered. For these a more tailored recruitment or training strategy could be necessary. For example, during the construction of the Thames Tideway Tunnel, a shortage of marine captains threatened to undermine the project. Given this, the client Tideway worked to develop specific training standards to provide the necessary workforce. This skills development has also been a key legacy of the project.
7. Identify strategic capabilities: While labour supply is the most important enabler, there are also critical components and capabilities that risk becoming blockers if not identified early. The approach to these instances should be aligned to any upcoming industrial strategy. In some cases, government providing suitable certainty and direction (as set out above) may be sufficient to allow industry to deliver. Leveraging tools such as R&D tax credits and ensuring the infrastructure industry can access them can also be important. However, in other cases, more direct government intervention can help to protect and expand British capabilities. The British Government did this successfully when it acquired Sheffield Forgemasters in 2021 for security reasons. It is now the only UK company capable of providing complex castings and forgings for civil nuclear power and defence.
8. Find resource internationally: In the medium and long term there can be no alternative to building domestic capability to deliver British infrastructure projects. Not least because where supply chains are allowed to degrade substantially, for example in the civil nuclear sector, they can take decades to rebuild. However, if the pipeline of projects planned for the next five to ten years is to be delivered on time, attracting workers from abroad to backfill acute shortages will be necessary. The alternative is to delay such projects to give the skills pipeline time to mature. As mentioned above, the shortage of lineworkers for the grid upgrade is likely to be a key bottleneck, even after reducing demand and shortening training required. Therefore, in the context of a few hundred lineworkers, time and project limited visa flexibility should be considered. Options include loosening the spoken English requirements under the core visa route or adding additional occupations (such as Electrical and Electronic Trades which are not currently eligible) to the Global Business Mobility visa. Furthermore, easing the process for someone who is self-employed but has a pipeline of potential work in the UK to do so should also be looked at. These should be considered on a time-limited basis, tied to specific projects or phases within projects, with the relevant sub-contractor accountable to ensure that workers do not overstay and are replaced by domestic workers as soon as is practicably possible.
9. Be outward-looking and encourage competition: Additionally, both the public and private sector should be prepared to embrace and adopt best practice globally. Given the small number of Tier 1 contractors now in the UK, public bodies should seek to strengthen their bargaining power by casting their nets further afield, in turn bringing in new expertise and capacity to the industry in the UK. Once again, certainty and clarity will be crucial, to ensure returns are sufficient to bring new entrants to the market. But we also shouldn’t overlook competition from smaller firms within the UK. Often, lip service is paid to getting more SMEs involved in public sector procurement. However, rarely is consideration given to looking at how the procurement process can be adapted to help this to happen and/or whether the contracting requirements can be met by SMEs (e.g., the level of financial liability accepted).
Organisation – Supply: Taking the lead and breaking down silos
The UK infrastructure supply chain is exceptionally fragmented compared to peer countries and has suffered from decades of uncertainty and underinvestment. In the medium to long term, that needs to change. But in the short term there is also a need for clients to take a greater leadership role in their supply chain – setting direction and coordination amongst suppliers. They also need to build skills and capability in supply chain management which is often lacking.
10. Be an activist buyer
a) Use scale as a strength, not a liability: The public sector is the ultimate client for many of the infrastructure projects coming down the pipeline, from the grid upgrades to Sizewell C to the New Hospitals Programme. It should use this to their advantage. As it stands, these projects often find themselves at the mercy of the suppliers, given the size and scale of what they need to deliver. A shift change is needed from seeing this scale as a liability to a strength. This relies partly on our recommendation for a detailed pipeline with strategic priorities. If a project is going ahead, has clear access to funding and is a priority, then it will enjoy significant buying power. But it also requires a change in mindset and approach to fully leverage scale. Key to this is greater standardisation and modularisation, particularly across a portfolio of projects and within sectors. For example, National Rail does this effectively by using its multi-year settlement to nationally procure products such as steel for rails and sleepers. This compares to water utility companies which tend to procure independently, meaning that in different parts of the country different pumps and valves are used, all of which require varying skill sets, tools and suppliers. Modularisation and prefabrication can also help to reduce demand for skilled labour in parts. Where scale can be leveraged it can therefore help to control demand and guarantee supply in a constrained environment.
b) Reach into supply chains: Clients can take a proactive role in reaching into their supply chain where they face bottlenecks and shortages. Rather than relying on sub-contractors to procure materials in a highly competitive global market, they could actively use their size to invest in co-development where they foresee critical needs or component shortages. For example, some large organisations have been co-investing in manufacturing plants in Asia to ensure the timely delivery of components given shortages in Europe. This can also involve bringing in downstream parts of the supply chain at an earlier stage, for example early contractor/supplier involvement. This means bringing those firms who will actually do the construction and/or installation into the design process early, helping to avoid the need for design and rescoping deep into a project. This in turn helps to avoid wasting scarce resource and funding.
c) Monitor performance and delivery: Finally, clients should show leadership by managing suppliers’ availability, delivery and performance. This can help to ensure that different suppliers are on site at the right time and that they are not contracting out the same resource multiple times (as often occurs). For example, during the construction of the Thames Tideway Tunnel, the client deployed members of their own team to shadow contractors’ work. This meant that where there were issues such as shipment delays or design mismatches, Tideway could immediately consider the impact this would have on the project as a whole, rather than responding to reporting from the supply chain. This kind of real-time engagement is particularly crucial when Tier 2 and 3 suppliers are being relied upon across multiple projects and sectors.
11. Become the client of choice: As has been established in this piece, the UK is moving towards a seller’s market. As a result, there is a greater emphasis on being a good client than ever before. In doing so, this is an important way to ensure there is suitable supply.
a) Be a responsible and committed customer: There are three key aspects here. First, consistency and commitment. Too often, large clients (particularly public sector ones) do not follow through on commitments and planned spending. In the end this is very bad business. Increasingly, suppliers will choose to work with other clients and maybe even move into other sectors. This means that the supply chain gets depleted, and it becomes even harder and more costly to deliver large projects down the line. Second, there is a responsibility on clients to provide consistent work to their supply chain. This means not sweating assets to the extreme to generate short-term savings or returns. In the end, this will end up being more costly when the time eventually comes to invest. Third, there is a need to move beyond just market engagement to market shaping. This links to our pipeline and scale points above but could also extend to bringing together groups of suppliers with different but complementary skills.
b) Take ownership: When suppliers have ample choice of where to work, a larger set of considerations will come into focus, beyond financial incentives. This should be led from the top and could include setting best practices when it comes to deploying digital tools and other technology, to drive improved productivity throughout the supply chain. It can also include making the project an attractive and safe place to work. For example, during the Thames Tideway Tunnel project, all sub-contractors, including drivers, were required to go through detailed health and safety training. The result was far fewer incidents on site, which in turn made it a more attractive destination for suppliers.
c) Leverage long-term contracts: Where financial contracts allow, longer-term contracts should be used to provide certainty to the supply chain to scale up. This is particularly important given the level of uncertainty that has persisted in the UK infrastructure sector over recent decades. This again links to the national level, where a clear pipeline and set of priorities can help facilitate longer-term contracts.
12. Develop an effective delivery and commercial model: Lastly, managing the supply chain on a large capital project requires clear responsibilities and incentives. Getting this right from the outset can have implications throughout the project. This means ensuring that the delivery model (who will do what) is joined up with the commercial/contracting model (how the work is purchased, priced and incentivised).
a) Identify the right contracting model: Different projects require different commercial arrangements. The scale, length, complexity and make-up of a project can all have implications for how a contract should be designed. But the common theme across all projects is the importance of ensuring the client and supply chain are incentivised to work together both during construction and often once the project has been operationalised. The continued move away from cost plus contracts is important here. Ultimately, save for small and simple projects, these contracts tend to create perverse incentives and reduce productivity. Again, we can look to the Thames Tideway Tunnel project as an example of best practice, which used NEC3 ‘pain/gain’ sharing contracts, with the three key contractors operating at different parts of the river. This ensured they shared in both cost savings and overflows, in addition to ensuring they are liable for their work for 12 years after completion.
b) Think carefully about allocating risk: Risk needs to be fairly (and ideally, equitably) allocated. It is not plausible for the client to hold all the risk, nor is it feasible to offload it all to the supply chain. Moreover, in some more heavily regulated sectors, it is also reasonable that some risk sits with the public sector. Part of this is ensuring contracts are sized and scoped correctly. If the contracts are so large that no supplier could ever take on the risk, then they will inherently become very risk averse and push all risk back onto the client. Another part of this is about ensuring roles are clearly defined within the delivery model, so everyone knows what they are responsible for and where the risk sits in different circumstances. These issues have been highlighted as key learnings from the Elizabeth Line project in its ‘learning legacy’ work. It highlighted that, “risk management should be seen as a collaborative process” and that, “risks should be owned by the organisation most able to manage the risk”.
This report would not have been possible without the contributions of the following BCG colleagues: Zoe Mebude-Steves, Belle van Zuilen, Alice von Wedel and Armaan Abootalebi. The authors would like to thank them for their support and are incredibly grateful for their invaluable work, particularly in analysing the data on which this report is centred.
About Us
Scope and methodology
Definitions
- Developmental capex: capital investment focused on new infrastructure, expansion, and major upgrades and which does not include capex for maintenance purposes.
- Digital sector: Includes telecoms and data centres.
- Institutional Sector: Predominantly prisons, healthcare and schools.
- Energy sector:
- Renewables – wind energy, solar, hydro-electric and ocean-based
- Networks – grid/transmission related, including pipelines
- Commercial and industrial sector: includes a wide range of projects covering office buildings, warehouses, lithium-ion battery manufacturing plants, hydrogen production plants and other industrial plants.
- Airport sector: We have (manually) included recent announcements made by the UK Government, including: Heathrow 3rd runway expansion, broader Heathrow planned upgrade, Stansted Airport upgrade, Gatwick Northern Runway, Luton Airport Capacity upgrade, London City Airport expansion, Doncaster Sheffield Airport expansion.
- Exclusions:
- Waste (municipal waste and waste treatment), mixed purpose, mixed use and housing sectors.
- Does not factor for unplanned/unannounced capex spend announced post December 2024.
- We converted the announced capex into GBP (if in different currency).
- Cleaned and grouped data under single project categories.
Recognising that capital projects often exceed budget and face delays, we adjusted the announced capex spend and timelines. We utilised two key databases:
- Oxford Global Projects - Tracks over 11,000 projects worth $3 trillion.
- BCG PRISM database - Builds on the Global Data’s Construction Projects Database to track 2,300 projects, leveraging the depth of data using publicly available sources such as government documents, industry reports and media releases to assess time and cost overruns.
- Energy sector
- Wind energy: average delay 13%, average overrun 22%
- Nuclear: average delay 65%, average overrun 122%
- Commercial and industrial sector
- Hydrogen production: average delay 45%, average overrun 27%
- Office buildings: average delay 38%, average overrun 59%
- All other projects: average delay 67%, average overrun 39%
- Rail: average delay 27%, average overrun 41%
- Institutional: average delay 10%, average overrun 56%
- Digital: average delay 67%, average overrun 39%
We applied an ‘S-curve’ methodology to determine the annual spend of each project. We believe this approach better reflects real-world project life cycles, where investment intensity varies across project phases, rather than a basic linear spend estimate:
- Lower capex outflow in initial (pre-construction) stages.
- Higher capex outflow during active construction phase.
Project drop-off adjustments
To account for potential project drop-offs post announcement, we evaluated projects announced between 2010 and 2020 and determined two key drop-off points:
- ~16% of projects drop-off or get cancelled post announcement.
- ~21% of projects remain in pre-construction stage for over 10 years indicating delays/ blockages.
- Exception 1: Airports sector – Heathrow third runway expansion project excluded in minimum capex estimate given uncertainty of spend in forecast period.
- Exception 2: Water sector – Given limited information on development spend, we have restricted to Ofwat’s specific guidance relating to Developmental Fund.
In order to determine the trend in terms of size of projects, we created five capex buckets based on increasing project value (<250Mn, 250-500Mn, 500Mn-1Bn, 1Bn - 5Bn, >5Bn). For each five-year period (from 2010), the share of projects in each bucket was determined based on relative count of projects.
Geo-spatial mapping
To understand the geographic distribution of capital projects, we have taken the stated value of the projects within our database and assigned the value to a County or Unitary authority using the coordinates provided in QGIS, enabling us to develop a sum total value for each area. The data presented was split into groups via the Jenks natural breaks statistical grouping method.
To assign an onshore location to offshore projects, we leveraged mapping software to identify the nearest landmass and then attributed the value to the relevant local authority. In practice this may have the effect of concentrating the value more than the reality suggests. For example, many offshore wind projects have been allocated to Aberdeenshire; however, in reality some of the impact of these projects is likely to also be felt in the city of Aberdeen, which is a separate local authority.
Where there were discrepancies within the data and the project’s actual location, we adopted the following approach:
- Where possible, projects above the value of £1 billion were reallocated in line with where the development is due to take place. For example, for the transmission grid upgrade the data presented high-level regional breakdowns (e.g., North, South, Midlands). We therefore allocated the spend equally across the authorities covered by that region. In a similar vein, for HS2 we have allocated half the value forecast spend in Birmingham and the other half in London.
- In some cases, it was not possible to reallocate the data provided. This is predominantly the case where national programmes have not provided geographic breakdowns or where the decisions are yet to be made. This includes all capital expenditure related to water. In these instances, these projects were removed from the data for the purposes of our regional mapping. In total, the projects removed from the database account for approximately 15% of the total 2025-2029 spend.
In order to develop the case studies, themes and proposed solutions, we interviewed experts and conducted desktop research using publicly available sources. All information used is in the public domain.
Critical materials shortages
The Systems Workbench for Insight on Transition Change – Green Transition (SWITCH-GT) has been built by BCG Henderson Institute (BHI). SWITCH-GT aggregates the value chains in the energy transition, representing a complex network of 1,700 technologies, components and materials. It covers over 1,000 industries, analysing individual value chains at a raw material level, simulates demand and estimates scarcity based on various future supply projections. For the purposes of this article, we have focused on our eight key sectors to identify potential bottlenecks and supply chain constraints using insights from SWITCH-GT.
Prices and lead times for grid inputs
The commentary and Exhibit 8 on the electricity grid have been drawn from a wider piece of BCG analysis on the challenge of overhauling transmission grids as part of the energy transition.
UK sector focus since 1950
Since reliable long run historical infrastructure investment data is not readily available across multiple sectors, we used proxy variables to assess the growth of fixed capital/capacity in some key sectors. Our objective was to determine the relative sectoral growth to identify capex hot spots since 1950. For this purpose, the following steps were undertaken:
- Housing, Energy, Prison, Reservoirs, Airports, Rail and Roads considered given data availability back to 1950.
- Measurable output metric determined for each sector (details below).
- CAGR (Compounded Annual Growth Rate) calculated over the entire period (baseline/Mean growth).
- Growth rate for each five-year period determined.
- Sector-wise Z-scores* determined in relation to the baseline. In this case the baseline is the mean annualised growth rate (in each sector) from 1950-2020.
We adopted the above approach to bring in a unified methodology to compare the performance across sectors.
As a proxy for the fixed capital/capacity in each sector we considered:
- Housing - stock of all dwellings
- Airports - Number of terminal passengers (2020 not considered as representative due to COVID impact and hence excluded)
- Energy - Electricity Generated (GwH)
- Prisons - Available capacity (male & female)
- Roads - Cumulative length of motorways (miles)
- Rail - Cumulative length of electrified mainline (kms)
- Reservoirs - Cumulative capacity / volume
By tracking these over time we can see the rate of change in key forms of fixed capital or capacity in key sectors. This provides a good proxy for the level and speed of capital investment and the level of construction in these sectors at any given period since 1950.


